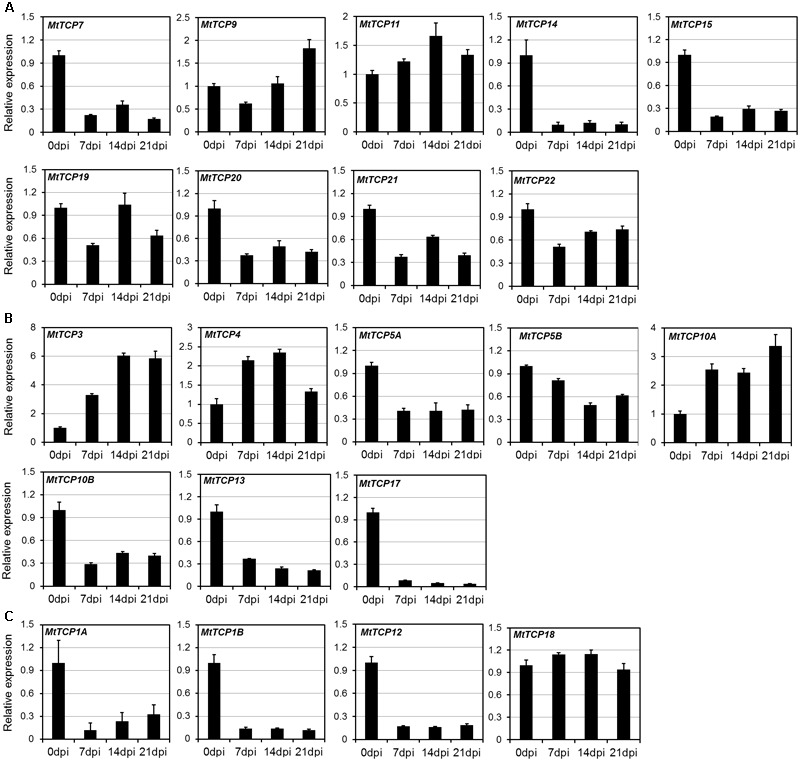
FIGURE 6.

Expression pattern of MtTCPs in different developmental stages of nodule using qRT-PCR. The relative expression level of MtTCPs of Class I (A), Class II CIN clade (B), and CYC/TB1 clade (C) in 0, 7, 14, and 21 days post inoculation (dpi) were detected by qRT-PCR. The expression profiles were normalized using MtUBI. Values are the mean and SD of three replicates.
