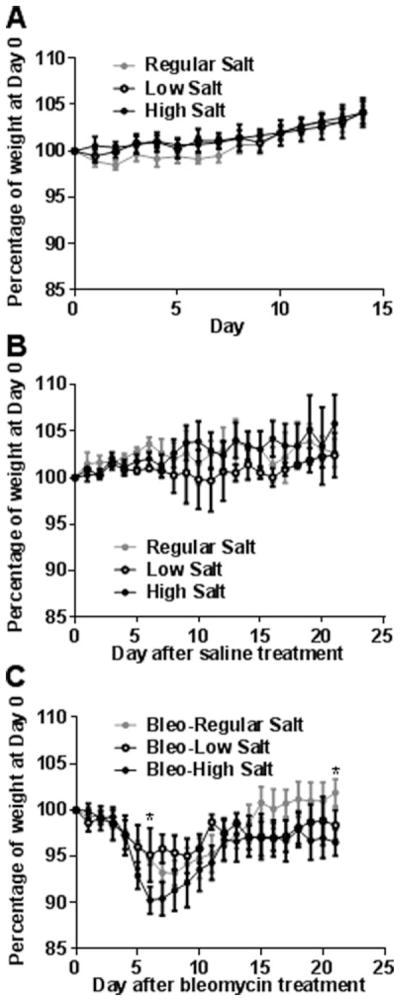
Figure 1. Dietary salt does not affect weight gain in mice and modulates bleomycin-induced weight loss.

A) Mice were fed low, regular, or high salt diets for 2 weeks and weighed daily, and the weight of each mouse was calculated as a percentage of the weight of the mouse at day 0. B) After 2 weeks exposure to the various salt diets, some of the mice from the groups in panel A received oropharyngeal saline, continuing the feeding on the low, regular, or high salt diets, and were weighed daily. Day 0 on the graph corresponds to the day of oropharyngeal saline. C) After 2 weeks exposure to the various salt diets, other mice from the groups in panel A received oropharyngeal bleomycin (Bleo) to induce pulmonary fibrosis, continuing the feeding on the low, regular or high salt diets, and were weighed daily. Values are mean± SEM, n = 3 mice for the control and bleo-low salt groups; n = 4 for the bleo-regular salt and bleo-high salt groups. In B, * indicates p<0.05 comparing high salt diet to regular salt diet (1-way ANOVA, Tukey’s test).
