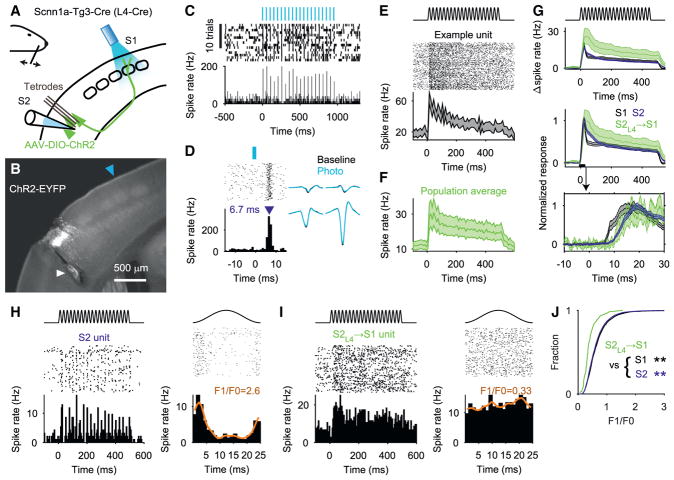
Figure 3. Putative S2L4→S1 Neurons Are Rapidly Excited by Touch.
(A) Tetrodes were used to record wS2 single-unit responses to whisker deflections in Scnn1a-Tg3-Cre mice injected with AAV-DIO-hChR2-EYFP into wS2. At the end of each recording session, trains of blue light pulses (2 ms pulses at 20 Hz) were applied over wS1 in order to antidromically stimulate putative S2L4 → S1 neurons.
(B) Expression of ChR2-EYFP in S2L4. Blue arrowhead: estimated location of the optic fiber tip over wS1. White arrowhead: electrolytic lesion used to locate the tetrode tract.
(C) Example spike raster and spike time histogram showing activity evoked by light pulses (indicated at top) for a putative S2L4 → S1 unit.
(D) Left: raster and PSTH for unit in (C) showing responses to all laser pulses within a shorter peri-stimulus time window. Blue arrowhead: spike latency (6.7 ms) measured from light onset to PSTH peak. Right: spike waveform means from the four tetrode channels, for spikes occurring in the absence (“Baseline”) of or in response to (“Photo”) light pulses.
(E) Top: schematic of the sinusoidal whisker deflection waveform (40 Hz, 0.5 s). Middle: spike raster for a putative S2L4 → S1 unit (first 100 trials). Bottom: PSTH (95% CI) for the example unit.
(F) Population average PSTH from putative S2L4 → S1 units (±95% CI; n = 58 units from 6 mice).
(G) Top: overlay of population average PSTHs (±95% CIs) for those wS1 (gray; n = 585), wS2 (blue; n = 1,557), and putative S2L4 →S1 (green; n = 39) units excited within the first 50 ms after stimulus onset. Middle: plot at top is shown after normalizing each PSTH to its peak. Bottom: zoom of time window near stimulus onset.
(H) Left: spike raster (first 100 trials) and PSTH for an example wS2 unit with reliable response to 40 Hz whisker deflection waveform. Right: stimulus cycle-locked raster plot and PSTH for same unit. Orange curve: kernel density estimate used to quantify the range (F1) and mean (F0) of the average response to one cycle of the whisker stimulus. The F1/F0 ratio quantifies the degree of cycle-by-cycle spike rate modulation for each unit.
(I) Same as (H) but for a putative S2L4 → S1 unit without clear cycle-by-cycle modulation.
(J) Cumulative histograms showing the F1/F0 ratio for all wS1 (n = 1,841), wS2 (n = 5,557), and putative S2L4 → S1 (n = 58) units. S2L4 → S1 units showed lower values compared with wS1 (**p = 4.4 × 10⁻⁹; Wilcoxon rank-sum) and wS2 (**p = 1.4 × 10⁻⁷; Wilcoxon rank-sum) units.

