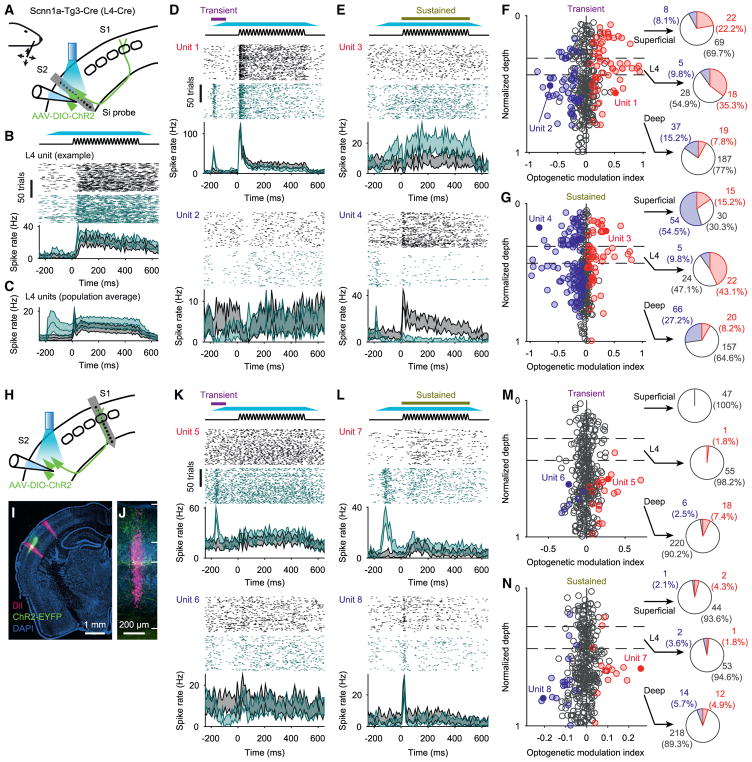
Figure 5. Excitation of S2L4 Neurons Modulates Activity across Layers in S2 and S1.
(A) Schematic of wS2 recording with S2L4 stimulation. Silicon probes recorded single units across layers in wS2. Responses were recorded to sinusoidal deflections of a single whisker along either horizontal or vertical orientations, and to optogenetic excitation (via ChR2) of S2L4 neurons that began prior to and spanned the duration of the whisker stimulus.
(B) Top: schematic of the whisker stimulus and 470 nm illumination (dark cyan). Middle: spike rasters for an S2L4 unit with (green) and without (black) optogenetic stimulation of S2L4 (first 100 trials for each). Bottom: PSTHs (95% CI) for the example unit with (green) and without (black) optogenetic stimulation.
(C) Population average PSTHs from S2L4 units with (green) and without (black) optogenetic stimulation (±95% CI; n = 51 units from 6 mice).
(D) Example units with significantly higher (unit 1, at top) or lower (unit 2, at bottom) spike rates during a “transient” phase of the optogenetic stimulus (indicated by purple horizontal bar at top; first 100 ms of LED illumination, from −200 ms to −100 ms relative to whisker stimulus onset). Conventions as in (B).
(E) Example units with significantly higher (unit 3, at top) or lower (unit 4, at bottom) spike rates during a “sustained” phase of the optogenetic stimulus (indicated by brown horizontal bar at top; 500 ms covering identical period as the whisker stimulus). Conventions as in (B).
(F) Optogenetic modulation index for the transient phase of the optogenetic stimulus, plotted for each unit as a function of normalized depth within cortex. Estimated boundaries of cortical layer 4 are indicated with horizontal dashed lines. Filled circles indicate significantly excited (red) or inhibited (blue) units. Example units from (D) are indicated (dark red and dark blue filled circles). Pie charts show percentages of units with significant optogenetic modulation for L4 and layers above (“superficial”) and below (“deep”) L4 (n = 393 units from 6 mice).
(G) Same as (F) but for the sustained phase of optogenetic stimulation.
(H) Schematic of wS1 recording with S2L4 stimulation. Experiments were identical to those of (A)–(G) except recordings were made in wS1.
(I) Coronal section showing DiI-marked silicon probe recording tracts (magenta) in wS2 (left tract) and wS1 (right tract), and ChR2-EYFP fluorescence in S2L4.
(J) Zoom of (I) showing wS2 tract and estimated pia, L4, and white matter boundaries (white horizontal lines).
(K–N) Same as (D)–(G) but for wS1 instead of wS2 recordings (n = 347 units from 6 mice).
See also Figure S6.

