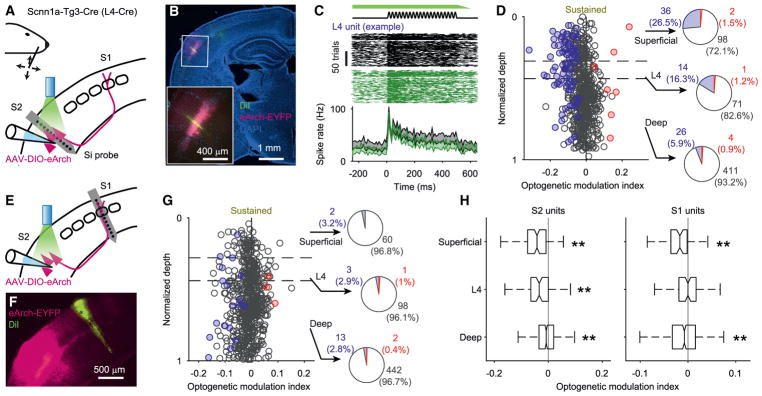
Figure 6. Inhibition of S2L4 Neurons Suppresses Activity in S2 but Only Weakly So in S1.
(A) Schematic of wS2 recording with S2L4 inhibition. Silicon probes recorded single units across layers in wS2. Responses were recorded to sinusoidal deflections of a single whisker along either horizontal or vertical orientations, with and without optogenetic inhibition (via eArch3.0) of S2L4 that began prior to and spanned the duration of the whisker stimulus.
(B) Coronal section showing DiI-marked silicon probe tract (green) in wS2, and eArch3.0-EYFP fluorescence in S2L4. Inset: zoom of region in white box.
(C) Top: schematic of the whisker stimulus and 565 nm illumination (light green; preceding ramp-up not depicted). Middle: spike rasters for an S2L4 unit with (green) and without (black) optogenetic inhibition of S2L4 (first 100 trials for each). Bottom: PSTHs (95% CI) for the example unit with (green) and without (black) inhibition.
(D) Optogenetic modulation index for the sustained phase (same time period as the whisker stimulus) of the optogenetic inhibition, plotted for each unit as a function of normalized depth within wS2 (n = 663 units from 6 mice). Conventions as in Figure 5F. Example L4 unit from (C) indicated by dark blue filled circle.
(E) Schematic of wS1 recording with S2L4 inhibition. Experiments were identical to those depicted in (A)–(D) except silicon probe recordings were made in wS1.
(F) Coronal section showing DiI-marked silicon probe recording tract (green) in wS1 and eArch3.0-EYFP fluorescence in S2L4.
(G) Same as (D) but for wS1 recordings (n = 621 units from 7 mice).
(H) Boxplots for wS2 (left) and wS1 (right) units depicting 25th, 50th, 75th percentiles and range of the optogenetic modulation index after removal of outliers (STAR Methods; **, wS2: superficial, p = 2.3 × 10⁻¹⁴; L4: p = 5.0 × 10⁻⁸, deep: p = 1.4 × 10⁻³; wS1: superficial: p = 5.8 × 10⁻⁵, L4: p = 1, deep: p = 3.7 × 10⁻⁴; sign tests).

