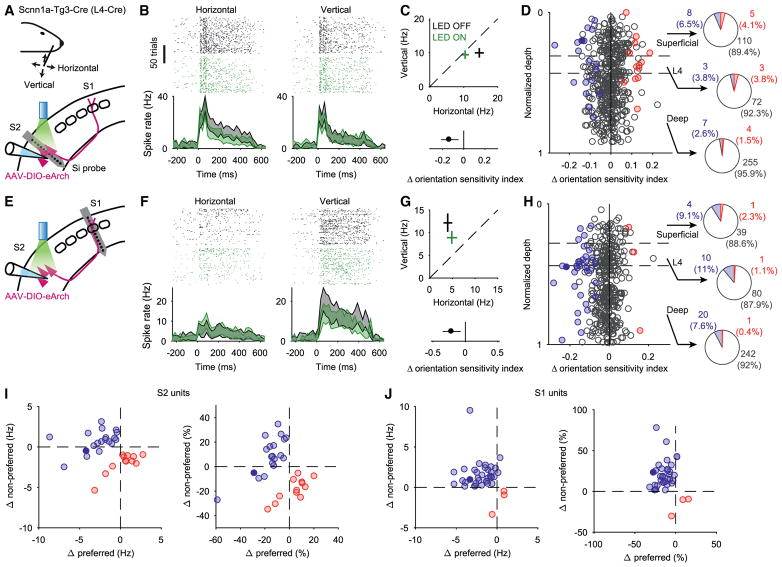
Figure 7. Inhibition of S2L4 Neurons Reduces Orientation Sensitivity in S1.
(A) Schematic of experiment: same as in Figure 6A, but with analysis (B)–(D) limited to whisker-responsive units.
(B) Spike rasters (first 100 trials) and PSTHs (95% CIs) showing responses to horizontal (left column) or vertical (right) whisker stimulations for a wS2 unit with (green) and without (black) inhibition of S2L4.
(C) Top: spike rate during horizontal versus vertical whisker deflections (means ± 95% CIs) for the example unit in (B). Bottom: change in orientation sensitivity index (OSI; ±95% CI) due to optogenetic inhibition for same unit.
(D) Change in OSI plotted for each whisker-responsive wS2 unit as a function of normalized depth within cortex. Conventions as in Figure 5F. Example unit from (B) indicated by dark blue filled circle. Pie charts show percentages of wS2 units with significant change in OSI during S2L4 optogenetic inhibition (n = 467 whisker-responsive units from 6 mice).
(E) Schematic of experiment: same as in Figure 6E, but with analysis (F)–(H) limited to whisker-responsive units.
(F and G) Same as (B) and (C) but for a wS1 unit.
(H) Same as (D) but for wS1 units (n = 398 whisker-responsive units from 7 mice). Example unit from (F) indicated by dark blue filled circle.
(I) Left: change in mean spike rate during inhibition of S2L4 for preferred and non-preferred whisker deflection orientations, for those wS2 units (filled circles from D) showing significantly increased (red; n = 12) or decreased (blue; n = 18) OSI. Right: same data as in left panel but expressed as percent change in firing rate.
(J) Same as (I) but for wS1 units (n = 3 and 34 units for increased and decreased OSI, respectively).
See also Figure S7.

