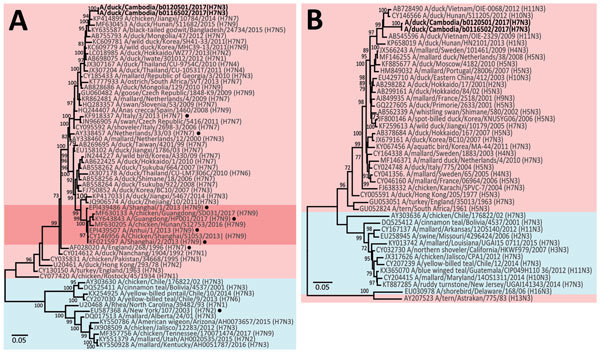
Figure 2.

Phylogenetic analysis of the H7 hemagglutinin (HA) gene (A) and N3 neuraminidase (NA) gene (B) of influenza viruses isolated from ducks in Kampong Thom Province, Cambodia (boldface), and reference isolates. Trees were generated using the maximum-likelihood method based on the general time-reversible model. Bootstrap values (n = 500) >70 are indicated. Light pink shading indicates strains from Eurasia, blue shading indicates strains from North and South America, and dark pink shading indicates H7N9 strains from China. Black dots indicate strains from human infections. GenBank accession numbers are provided for reference isolates. Scale bars indicate nucleotide substitutions per site.
