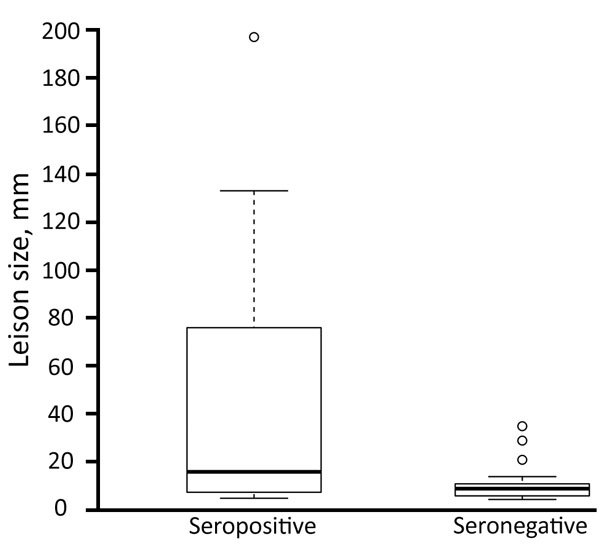
Figure 2.

Differences in sizes of lesions (n = 49 serum samples available from 57 patients with measured lesions) diagnosed in persons seropositive by ELISA, Western blot, or both (n = 27) or seronegative (n = 22) in a study of alveolar echinococcosis, southern Kyrgyzstan, 2012. Box plots indicate interquartile range (box top and bottom), median (black horizontal line), 1.5 times interquartile range (error bars), and extreme values (circles).
