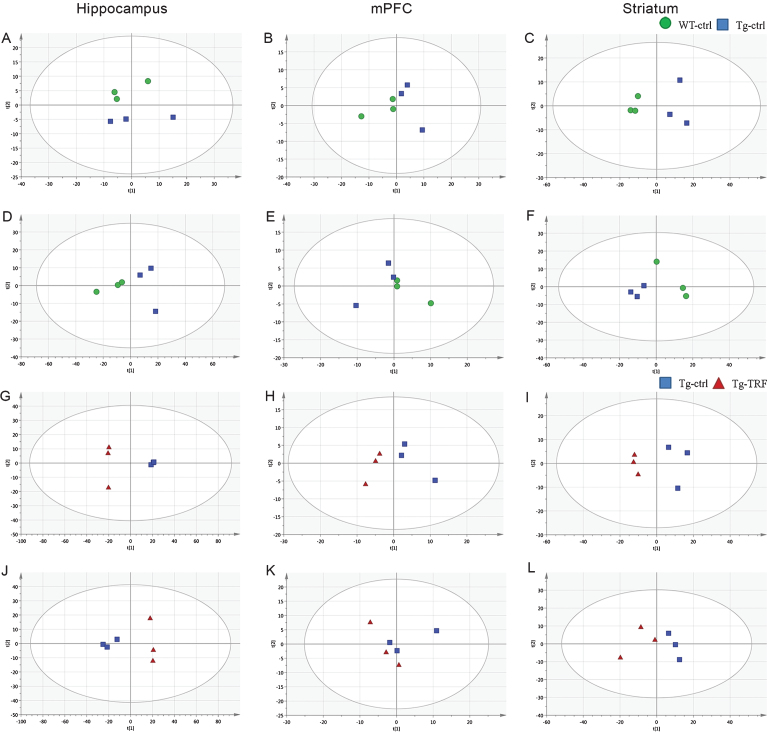
Fig. 5.
Principal component analysis (PCA) score plots from hippocampus, mPFC, and striatum obtained by ESI (+) and ESI (–) modes. A-C) PCA score plots from WT-ctrl and Tg-ctrl mice obtained by ESI (+). D-F) PCA score plots from WT-ctrl and Tg-ctrl mice obtained by ESI (–). G-I) PCA score plots from Tg-ctrl and Tg-TRF mice obtained by ESI (+). J-L) PCA score plots from Tg-ctrl and Tg-TRF mice obtained by ESI (–).

