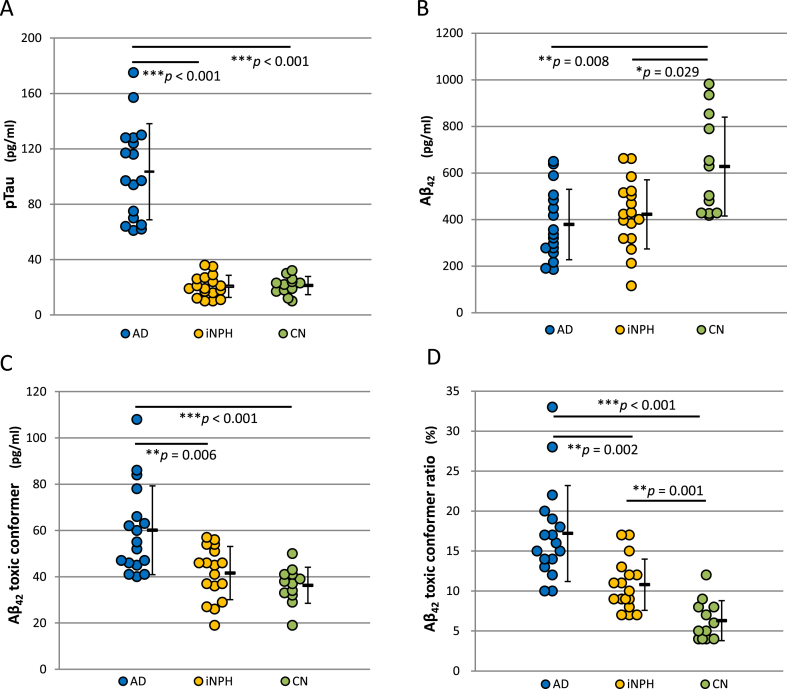
Fig.2.
The analyses of cerebrospinal fluid markers in the three patient groups. A) pTau was significantly higher in the AD group compared to the iNPH group (p < 0.001), or the CN group (p < 0.001). No significant difference was seen between the iNPH and CN groups. B) Aβ42 was significantly low in the AD group (p = 0.008) and the iNPH group (p = 0.029) compared to the CN group. No significant difference was seen between the AD and iNPH groups. C) Aβ42 toxic conformer was high in the AD group compared to the iNPH group (p = 0.006), compared to the CN group (p < 0.001). No significant difference was seen between the iNPH and CN groups. D) Aβ42 toxic conformer ratio, indicating the percentage of Aβ42 toxic conformer to total Aβ42, was highest in the AD group, followed by the iNPH group, and lowest in the CN group (AD versus iNPH: p = 0.002; iNPH versus CN: p = 0.001; AD versus CN: p < 0.001).

