Fig.4.
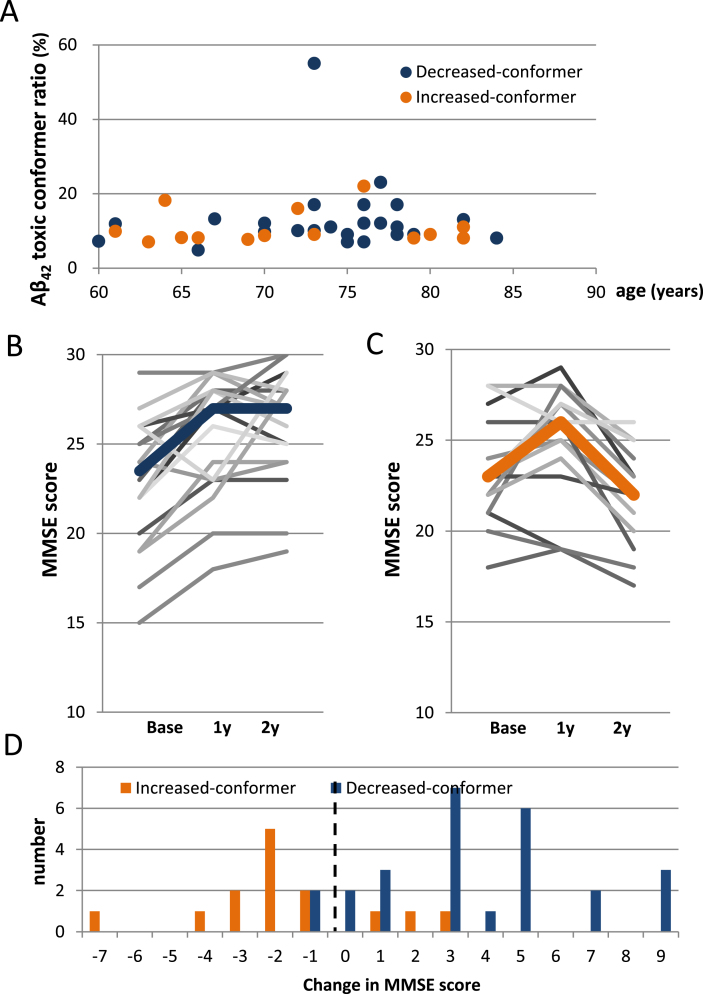
Postoperative transitions of MMSE scores in the decreased- and increased-conformer group. A) A scatter plot showing no correlation between Aβ42 toxic conformer ratio and age (Pearson’s coefficient 0.026, p = 0.873). B) Postoperative transitions of MMSE scores in the decreased-conformer group showing significant improvement from the baseline at both 1- and 2 years after CSF shunting (both: p < 0.001). C) Postoperative transitions of MMSE scores in the increased-conformer group showing no significant change between the baseline and 1 year after CSF shunting; however, a significant decline was revealed between 1- and 2 years after CSF shunting (p = 0.036). D) A distribution of 2 tears postoperative changes in MMSE scores showing that scores of 11/14 patients (78.6%) of the increased-conformer group declined 2 years after CSF shunting, while scores of only 2/26 patients (7.7%) of the decreased-conformer group declined. The right side of the dotted line indicates an improvement in MMSE score.

