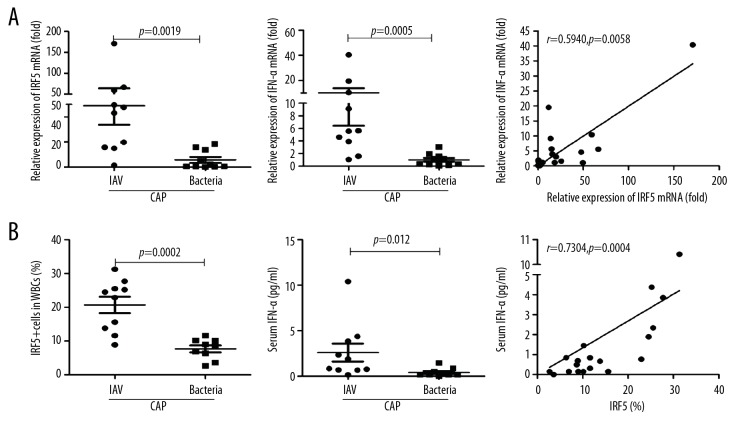
Figure 5.
The expression levels of IRF5 and IFN-α between CAP patients infected with influenza A virus (IAV) and those infected with bacteria. Total RNA was isolated from the peripheral blood for amplifying the mRNA of IRF5 and IFN-α. The percentages of IRF5+ WBCs were determined by flow cytometry. The concentrations of serum IFN-α were determined by cytometric bead array. (A, B) The mRNA (A) and protein (B) levels of IRF5 and IFN-α between CAP patients infected with IAV and those infected with bacteria. Data are presented as the mean ±SEM (n=10 for IAV-infected patients and n=10 for bacteria-infected patients). Comparisons between 2 groups were performed using the Mann-Whitney U test. Correlations were tested using the Spearman’s test. P<0.05 was considered to indicate a statistically significant difference.

