Figure 2.
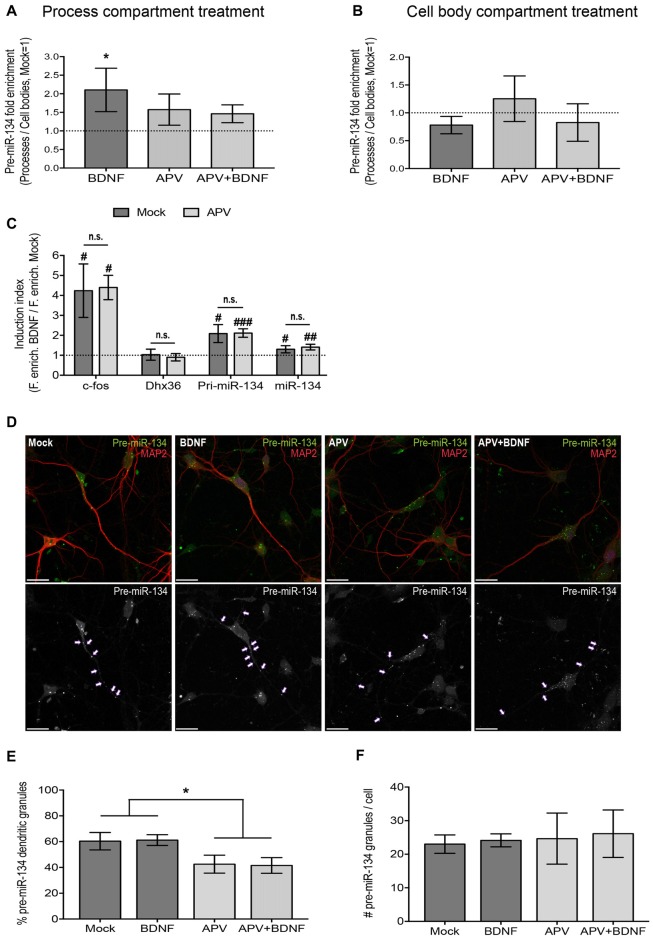
NMDA receptor (NMDAR) blockade impairs dendritic accumulation of pre-miR-134. (A,B) qPCR using RNA extracted from both the process and cell body compartment of DIV19 hippocampal neurons cultured on filter inserts and treated in both compartments with APV/Mock for 30 min and with BDNF/Mock for 2 h selectively in the process (A) or cell body (B) compartment. Values represent the mean of the relative process enrichment (ratio process vs. cell body expression) of pre-miR-134 ± SD. Values obtained for Mock-treated neurons are set to one. n = 3 independent experiments. One-way ANOVA and Tukey’s post hoc test, *P < 0.05. (C) qPCR for indicated genes using RNA extracted from DIV5 cortical neurons treated with BDNF (3 h) in the presence or absence (Mock) of APV. Values represent the mean BDNF induction index (ratio fold enrichment BDNF vs. Mock) ± SD of n = 4 independent biological replicates. Mock vs. APV: two-sample students t-test (n.s.). BDNF vs. Mock: one-sample or two-sample students t-test, #P < 0.05, ##P < 0.01, ###P < 0.0001. (D) Representative pictures of DIV7 hippocampal neurons transfected with in vitro synthesized Cy3-pre-miR-134 and simultaneously treated with BDNF in the presence or absence of APV. Upper panel: Merged images of Cy3-pre-miR-134 (green), MAP2 (red). Lower panel: High contrast black-and-white images from the Cy3-pre-miR-134 channel only. Arrows point to dendritic pre-miR-134 granules (scale bar: 20 μm). (E,F) Quantification of multiple neurons shown in (D). Values represent the percentage of dendritically localized (E) or the total number (F) of Cy3-pre-miR-134 granules per cell ± SD. n = 42 cells analyzed per data point from n = 3 independent biological replicates. One-way ANOVA and Tukey’s post hoc test, *P < 0.05.

