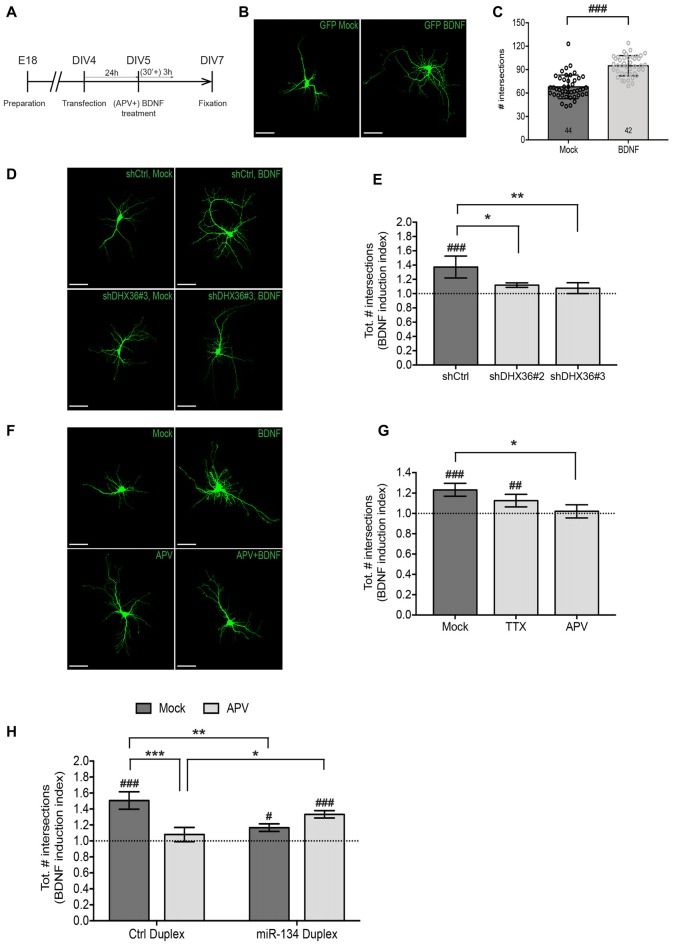
Figure 4.
NMDAR-dependent dendritogenesis requires miR-134. (A) Experimental strategy to assess BDNF-induced dendritic outgrowth in immature neurons. Hippocampal neurons were transfected at DIV4, treated 24 h later for 3 h with BDNF in the presence or absence of APV (30 min pre-treatment) and fixed 48 h after the treatment. (B) Dendritic arborization of representative GFP-transfected hippocampal neurons (DIV7) processed as indicated in (A) without APV pre-treatment (scale bar: 50 μm). (C) Quantification of dendrite complexity of multiple neurons from (B) using Sholl analysis. Values represent the average total number of intersections obtained with Sholl analysis ± SD. n = 44 (Mock), n = 42 (BDNF) cells analyzed per data point from n = 4 independent biological replicates. Mann-Whitney test, ###P < 0.0001. (D) Dendritic arborization of representative GFP-transfected hippocampal neurons (DIV7) co-transfected with indicated shRNA constructs and further processed as indicated in (A) but without APV pre-treatment (scale bar: 50 μm). (E) Quantification of dendrite complexity of multiple neurons from (D) using Sholl analysis. Values represent average BDNF induction indices (total number of intersections in BDNF vs. Mock-treated neurons) ± SD of n = 4 independent biological replicates. Two-way ANOVA and Dunnet’s, *P < 0.05; **P < 0.01. BDNF vs. Mock: one-way ANOVA and Bonferroni, ###P < 0.001. (F) Dendritic arborization of representative GFP-transfected hippocampal neurons (DIV7) processed as indicated in (A) (scale bar: 50 μm). (G) Quantification of dendrite complexity of multiple neurons from (F) using Sholl analysis. Values represent average BDNF induction indices (total number of intersections in BDNF vs. Mock-treated neurons) ± SD of n = 3 independent biological replicates. Two-way ANOVA and Dunnet’s *P < 0.05. BDNF vs. Mock: one-way ANOVA and Bonferroni, ##P < 0.01, ###P < 0.001. (H) Quantification of dendrite complexity of neurons transfected with the indicated duplex RNA and treated with BDNF in the presence or absence of APV using Sholl analysis. Values represent the average BDNF induction indices (total number of intersections in BDNF vs. Mock-treated neurons) ± SD of n = 3 independent biological replicates. Number of analyzed cells and individual data points are indicated and analyzed in Supplementary Figure S3. Two-way ANOVA and Tukey’s, *P < 0.05, **P < 0.01, ***P < 0.001. BDNF vs. Mock: Kruskal-Wallis and Dunn’s, #P < 0.05, ##P < 0.01, ###P < 0.001.

