Figure 5.
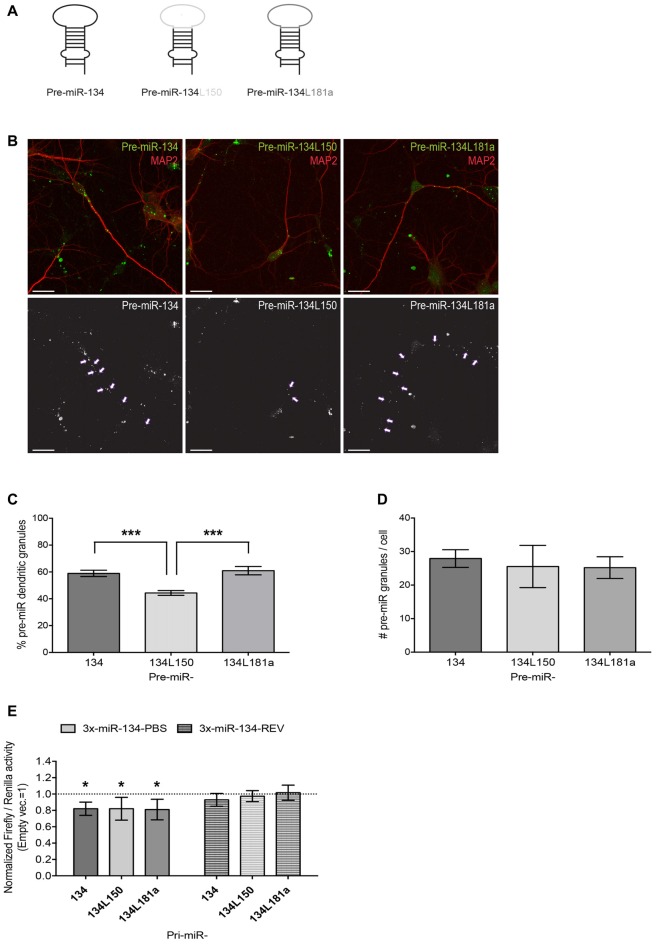
Design and validation of functionality and subcellular localization of pre-miR-134 chimeras. (A) Graphic representation of pre-miR-134 chimeras tested for subcellular localization. The pre-miR-134 terminal loop was substituted with either the one from pre-miR-150 (pre-miR-134L150) or the one from pre-miR-181a (pre-miR134L181a). (B) Representative pictures of developing hippocampal neurons transfected with in vitro synthesized Cy3-labeled pre-miRNAs described in (A). Upper panel: merged images of Cy3-pre-miRNAs (green) and MAP2 antibody staining (red). Lower panel: high contrast black-and-white image of the Cy3-pre-miRNA signal only. Arrows point to dendritic pre-miR-134 granules (scale bar: 20 μm). (C,D) Quantification of dendritic pre-miRNA granules from multiple neurons shown in (B). Values represent the average percentage of dendritically localized (C) or the total number/cell (D) of Cy3-pre-miRNA granules ± SD. n = 40 cells analyzed per data point from n = 3 independent biological replicates. One-way ANOVA and Tukey’s, ***P < 0.001. (E) Luciferase reporter gene assays performed using plasmids containing either 3xmiR-134 perfect binding sites (3x-miR-134-PBS) or the corresponding reverse sequence (3x-miR-134-REV) in the firefly luciferase 3′UTR. Firefly reporters were co-transfected with the indicated pre-miRNA expression vectors (or empty pcDNA3) and Renilla luciferase expression was used for internal normalization. Firefly/Renilla ratios were calculated for miR-134 reporters and subsequently normalized to the ratios obtained with the pmirGLO empty vector. The condition co-transfected with empty pcDNA3 was set to one (not shown). Values represent the mean normalized luciferase activity ± SD of n = 4 independent biological replicates. One-sample t-test, *P < 0.05.

