. 2016 Feb 3;7(5):3052–3061. doi: 10.1039/c5sc04383b

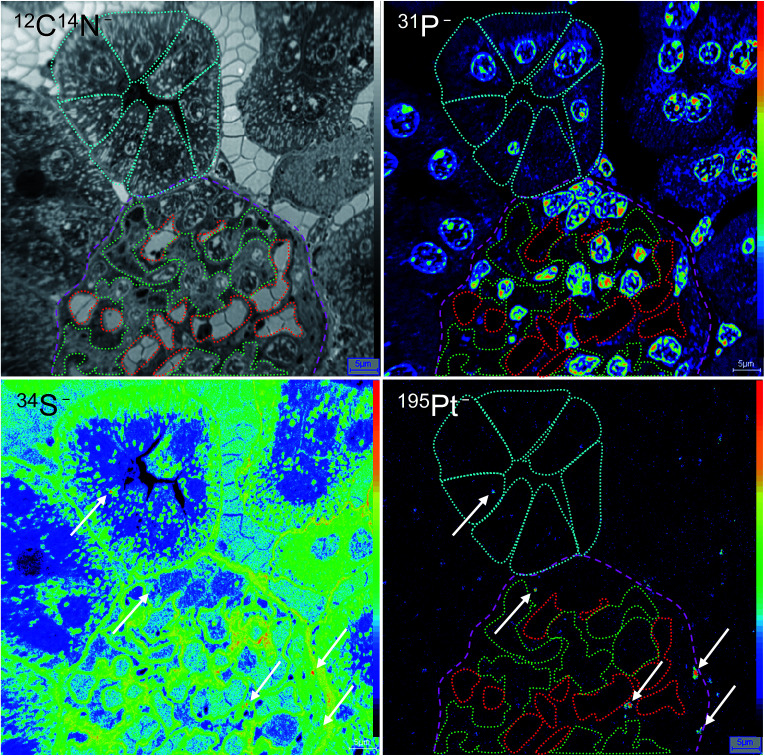
Fig. 3. Platinum distribution in mouse kidney upon treatment with compound 1. NanoSIMS 12C14N, 31P, 34S, and 195Pt secondary ion signal intensity distribution images show the subcellular platinum localization in a semi-thin section of a murine kidney cortex. Colored regions of interest (ROI) refer to glomerulus (magenta), proximal convoluted tubule cells (cyan), mesangial cells (green), and capillaries (red). Arrows show platinum hotspots co-localized with sulfur-rich cytoplasmic organelles in podocytes and cells of the tubule. Intensities are displayed on a false color scale, ranging from low intensities (black) to high intensities (red/white). Scale bars = 5 μm.

Fig. 3