. 2016 Feb 3;7(5):3052–3061. doi: 10.1039/c5sc04383b

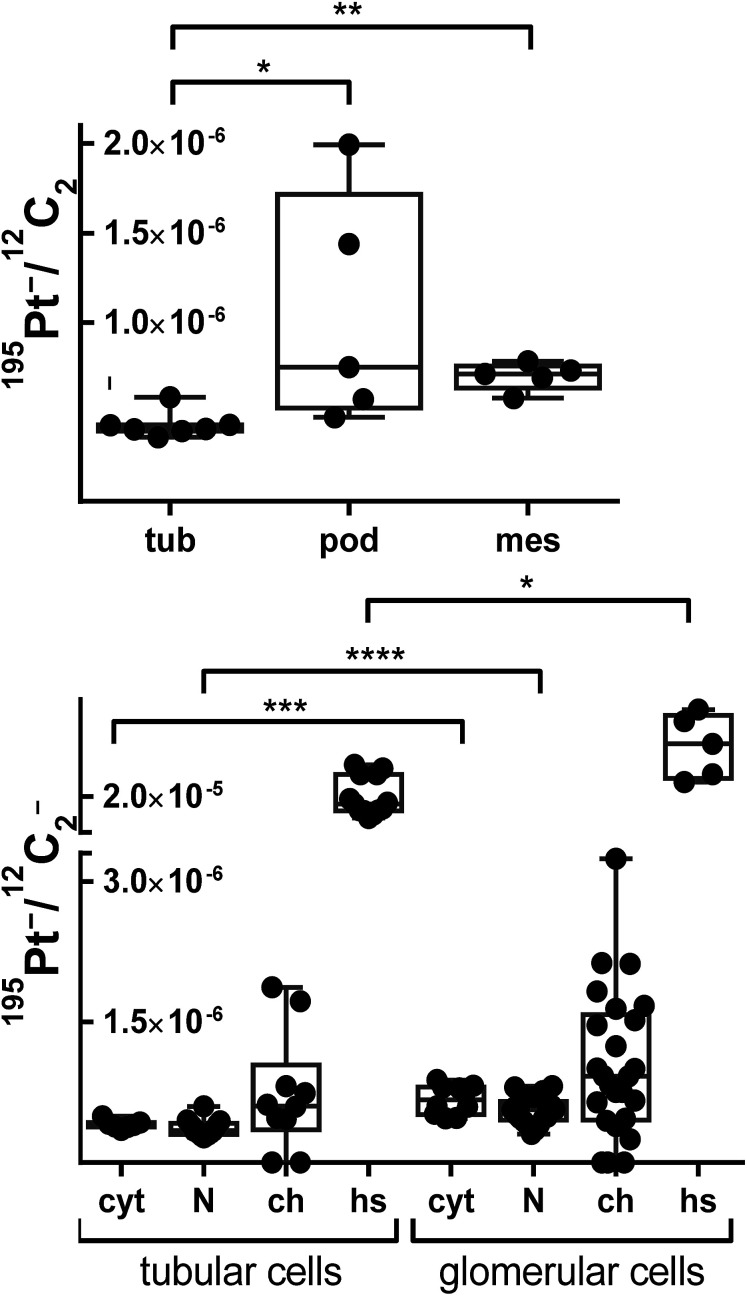
Fig. 4. Relative platinum content in different mouse kidney cell types (top) and average relative platinum accumulation in different cell compartments (bottom) upon treatment with compound 1. Data were inferred from ROI specific evaluation of 12C2 normalized 195Pt secondary ion signal intensity images. Data points refer to individual ROI values. The box-and-whisker plots display the extreme values (min/max), median and lower/upper quartiles. Asterisks refer to the significance level with *p < 0.05, **p < 0.01, ***p < 0.001, ****p < 0.0001. Labels: tub – proximal tubule cells; pod – podocytes; mes – mesangial cells; cyt – cytoplasm; N – nucleus; ch – chromatin; hs – platinum hotspots/aggregations.

Fig. 4