. 2016 Feb 3;7(5):3052–3061. doi: 10.1039/c5sc04383b

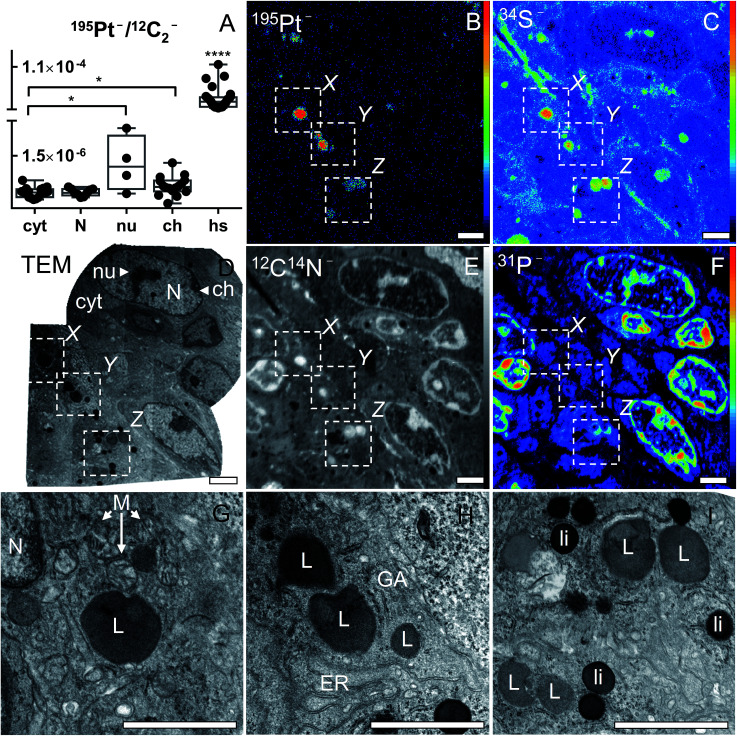
Fig. 5. Platinum distribution in cancer cells from a CT-26 tumor-bearing mouse upon treatment with compound 2. Asterisks refer to the significance level with *p < 0.05 and ****p < 0.0001. NanoSIMS 195Pt, 34S, 12C14N and 31P secondary ion maps (B, C, E and F) show the subcellular localization of the elements in an ultra-thin section of malignant tissue. Intensities are displayed on a false color scale ranging from low intensities (black) to high intensities (red/white). TEM micrographs show the ultrastructure of the corresponding area from a consecutive resin section: overview (D); magnification of platinum-accumulating structures (hotspots) confirming the platinum co-localization with S-rich organelles of lysosomal origin (G, H and I). Field of views in TEM images shown in panels G, H and I correspond to X, Y, and Z areas in panels B–F, respectively. Labels: N – nucleus; nu – nucleolus; ch – chromatin; cyt – cytoplasm; hs – platinum hotspots; M – mitochondria; L – lysosomes; ER – endoplasmic reticulum; GA – Golgi apparatus; li – osmiophilic lipid droplets. Scale bars = 2 μm.

Fig. 5