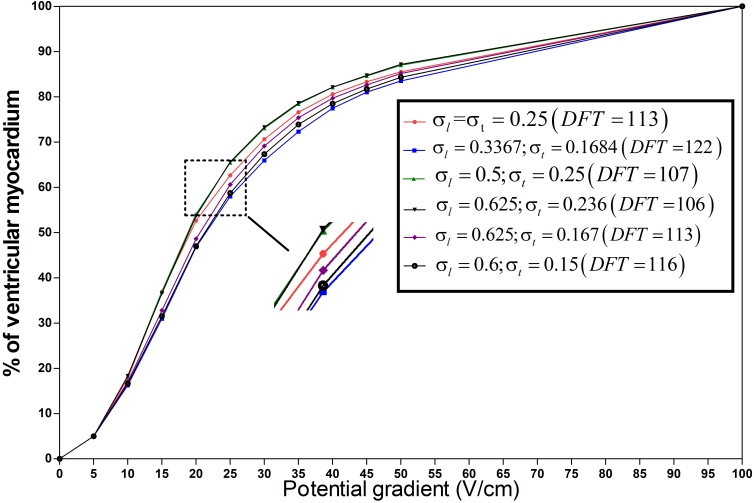
Figure 4.
The percentage of ventricular myocardial mass below discrete potential gradients in different anisotropic conductivity. The right diagram shows the case in Table 1 with different anisotropy ratios(), which are 1:1, 2:1, 2:1, 2.648:1, 3.74:1, 4:1 respectively. The units of conductivity and are S/m, the units of DFTs are V.

