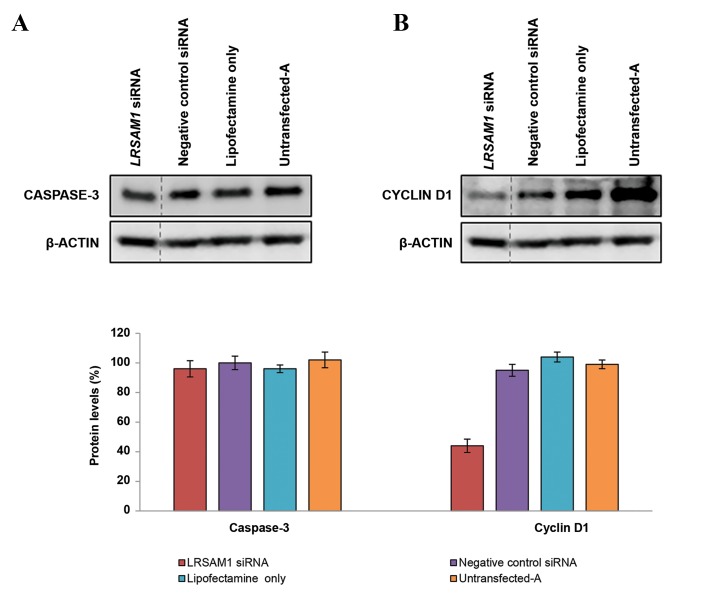
Fig.3.
Investigation of apoptotic (caspase-3) and cell cycle (cyclin D1) markers in LRSAM1 knockdown SH-SY5Y cells. Western blot analysis of A. Caspase-3and B. Cyclin D1 levels compared with the controls (negative control siRNA, lipofectamine only and untransfected-A cells). Protein levels were determined 96 hours after the first transfection. ß-ACTIN was used as an internal control. Quantification of caspase-3 and cyclin D1 was performed relative to ß-ACTIN. Untransfected-A cell values (caspase-3 and cyclin D1) were set to 100%. Caspase-3 levels: LRSAM1 siRNA transfected cells (96 ± 5.48%, P<0.018), negative control siRNA transfected cells (100 ± 4.55%, P<0.02), lipofectamine only transfected cells (96 ± 2.58%, P<0.019) and untransfected-A cells (102 ± 5.31%). Cyclin D1 levels: LRSAM1 siRNA transfected cells (44 ± 4.50%, P<0.005), negative control siRNA transfected cells (95 ± 3.99%, P<0.009), lipofectamine only transfected cells (104 ± 3.33%, P<0.03) and untransfected-A cells (99 ± 2.92%).

