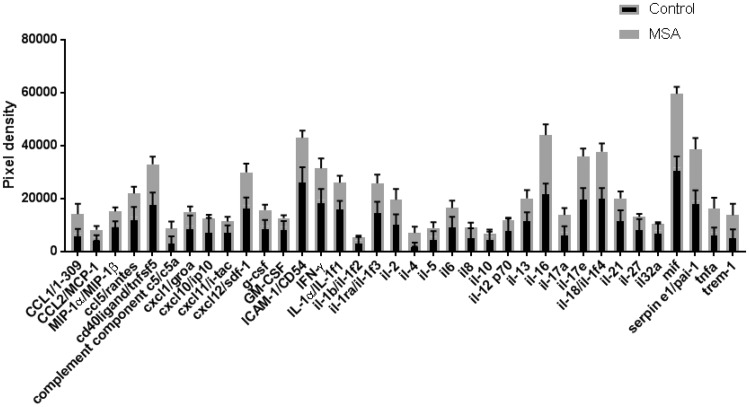
FIGURE 2.
Cytokine expression. Statistical analysis of cytokine array data from a panel of 36 cytokines by multiple t tests using the 2-stage linear set-up procedure of Benjamini, Krieger, and Yekutieli, with Q=1%, showed no significant alteration in cytokine expression in MSA compared with control.

