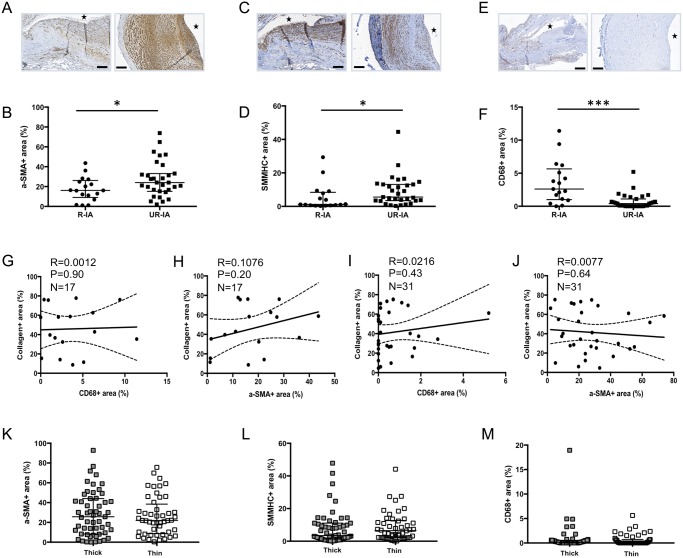
FIGURE 4.
Cellular content of ruptured and unruptured intracranial aneurysms (IAs). Representative examples and quantification of α-SMA (SMCs in brown, A, B), SMMHCs (differentiated SMCs in brown, C, D) and CD68 (macrophages in brown, E, F) in ruptured and unruptured IA domes. Total collagen content is not correlated with CD68 (G, I) or α-SMA (H, J) contents in R-IAs (G, H) and UR-IAs (I, J). Total SMC (K), differentiated SMC (L) and macrophage (M) contents are not affected by the thickness of the aneurysmal wall in UR-IAs. The lumen of the vessel is indicated by a star. Results are shown as individual values and as median ± interquartile range. *p ≤ 0.05, ***p < 0.001, nonparametric Mann-Whitney U test. Scale bars: A, C, E = 100 μm.

