
Figure 2.
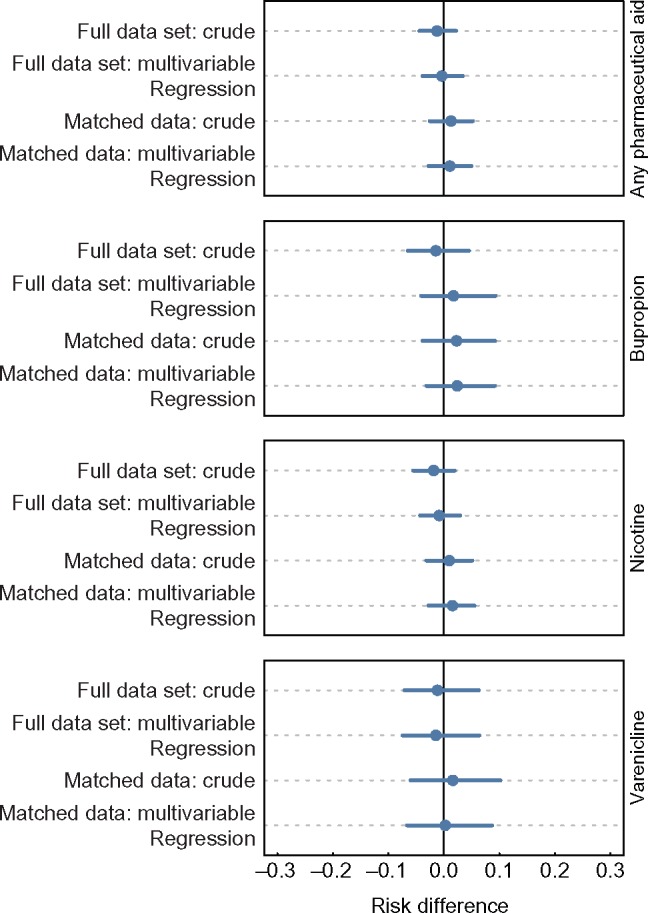
Dot plots illustrating the difference in the probability of remaining abstinent from smoking for at least 30 days between adults who used or did not use pharmaceutical aids, among adults who made quit attempts in the Tobacco Use Supplement to the Current Population Survey, United States, 2002–2003 and 2010–2011. The dots and lines represent means and 95% confidence intervals for the risk difference. The first two models estimating risk differences in each box are logistic regression models fit to the full unbalanced data set, and the next two models are logistic regression models fit to the data sets that were balanced using matching. The crude models include only the use of medication, while the multivariable models include the use of medication and a number of treated controls. Nearest-neighbor matching was used to balance samples for every medication assessed. A 1:1 nearest-neighbor matching ratio was used for matching the any pharmaceutical aid and nicotine groups, and a 2:1 nearest-neighbor matching ratio was used for matching the bupropion and varenicline groups.