Figure 2.
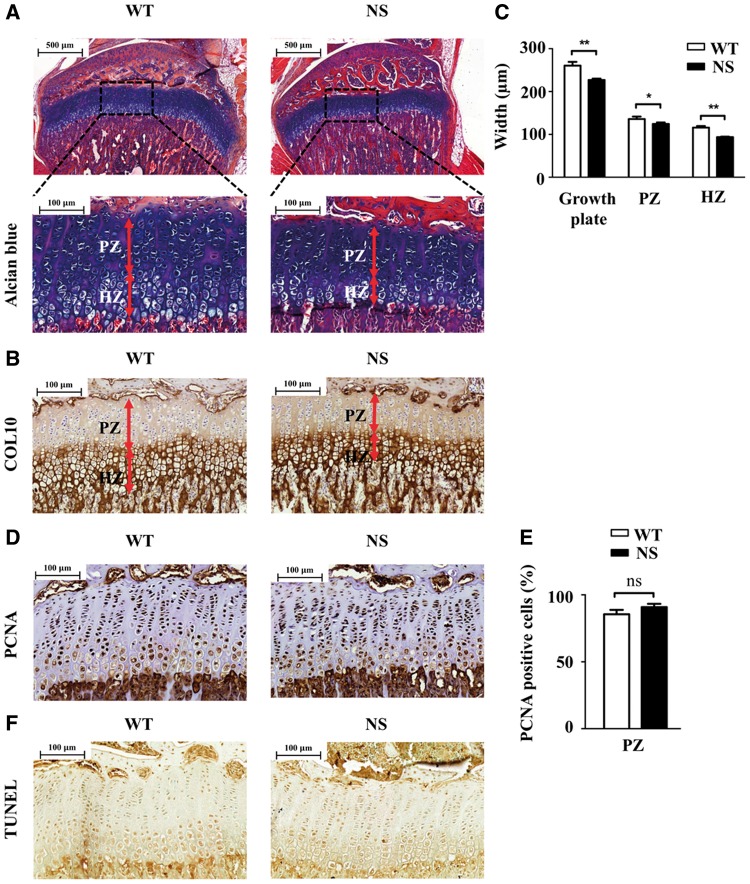
Decreased growth plate width in NS mice. Histological sections from tibiae of 4-week-old WT (n=12) and NS (n=9) mice. (A and B) Alcian blue (A) and COL10 (B) staining of growth plate. (C) Measurements of different chondrocyte zones, showing a decrease of the widths of the hypertrophic zone, and to a lesser extent of the proliferating zone, in NS mice. (D) PCNA immunostaining to evaluate chondrocyte proliferation. (E) Quantification of the number of cells positive for PCNA per surface in the proliferating zone of the growth plate. There was no difference between WT and NS mice. (F) Colorimetric TUNEL assay to evaluate chondrocyte apoptosis. Values are means ± SEM. Significant statistical differences between groups: **P<0.01, *P<0.05 (two-tailed Student’s t-test).

