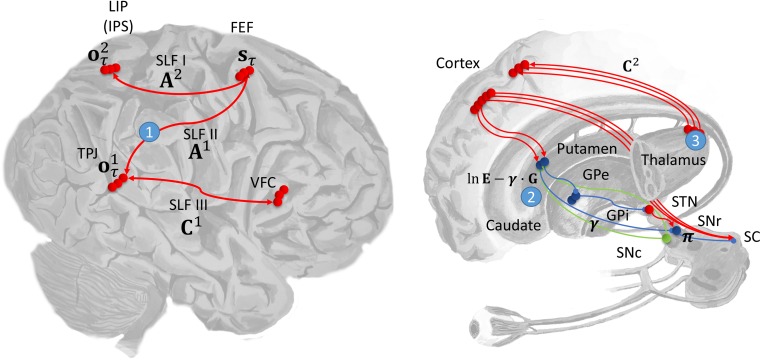
Figure 4.
Computational anatomy and lesion sites. This schematic illustrates the proposed mapping from the computational entities implicated by the model (Figs 2 and 3) and their neuroanatomical substrates. On the left the dorsal and ventral attention networks are shown. The former involves the frontal eye fields (FEF) and posterior parietal areas in the region of the lateral intraparietal area (LIP) and intraparietal sulcus (IPS). The frontal areas of this network are assumed to represent the hidden states, corresponding to the current fixation location. The parietal component represents proprioceptive outcomes (eye position). The connection between these frontoparietal areas is the first branch of the superior longitudinal fasciculus (SLF I), mediating the likelihood mapping between the hidden states and proprioceptive outcomes (). The ventral attention network includes the ventral frontal cortex (VFC) and the temporoparietal junction (TPJ). These are connected by SLF III, which could carry prior preferences about visual outcomes (). Visual outcomes are assumed to be represented in the TPJ, which suggests the SLF II is the mapping from hidden states to visual outcomes (), and it is in these connections that the beliefs about the target locations are encoded. Prior preferences for proprioceptive outcomes are assigned to the pulvinar, a nucleus of the thalamus. On the right the connections from the pulvinar to the dorsal parietal cortex (LIP) are shown. These are portrayed as conveying expectations about (proprioceptive) outcomes in . In addition, the pathways through the basal ganglia are also shown. The policy evaluation processes shown in Figure 2 are depicted as stages in the direct pathway. In this scheme, the putamen evaluates the expected free energy, and baseline policy priors, . These are modulated by dopaminergic inputs from the substantia nigra pars compacta , in proportion to their precision , and the output of the putamen is transformed by the substantia nigra pars reticulata into a distribution over policies. The simulated lesions we considered are numbered: 1—SLF II; 2—Putamen; 3—Pulvinar. As in the previous figure, red connections are excitatory, blue inhibitory, and green modulatory.

