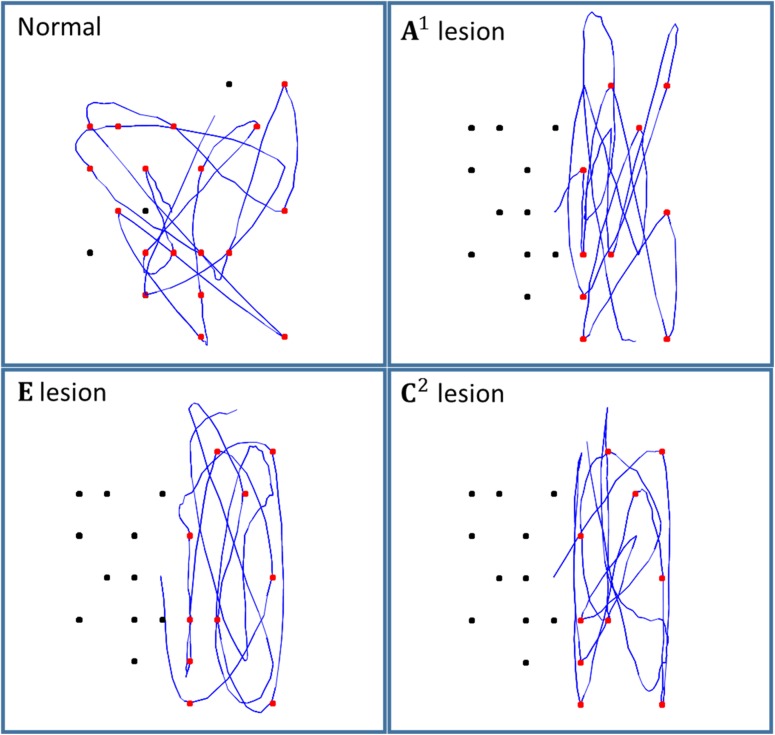
Figure 5.
Simulated saccadic cancellation task. Each of the panels shows the simulated eye tracking data (blue) during 20 saccades. In all cases, the target array was the same. The upper left panel shows the performance of the model with no simulated lesions. The upper right panel shows the results when the Dirichlet parameters were increased for the left hemifield, corresponding to a functional disconnection of the second branch of the right superior longitudinal fasciculus. The lower left panel shows performance when there is a biasing of policy selection, simulating a lesion of the putamen. The lower right panel represents a lesion of the prior beliefs about proprioceptive outcomes, which relates to a deficit in the inputs to the dorsal parietal cortex, likely from the pulvinar.

