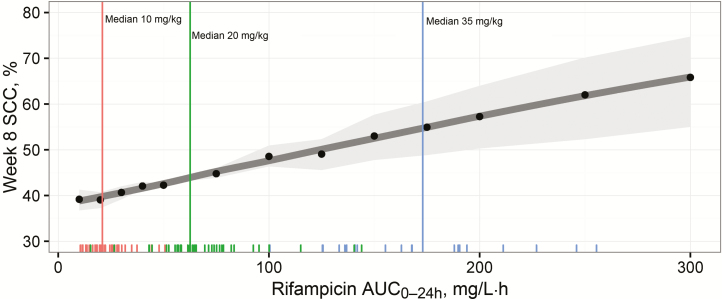
Figure 4.
Expected proportion of patients with sputum culture conversion (SCC) at week 8 over varying rifampicin exposures for a virtual population of patients (distribution of baseline bacterial load and missing sputum samples mimicking that of the study) treated with standard doses of isoniazid, pyrazinamide, and ethambutol. Black dots represents simulation results (n = 10000 in each); dark gray line, a locally weighted smooth of the simulation results; and light gray shaded area, 95% confidence interval based on the uncertainty in the estimate of the parameter for rifampicin effect. Vertical lines represent median observed exposures in the dose groups 10 (red), 20 (green), and 35 (blue) mg/kg, respectively, and tick marks at the bottom of the graph are individual observed exposures. Abbreviation: AUC0–24h, area under the curve from 0 to 24 hours after dose.

