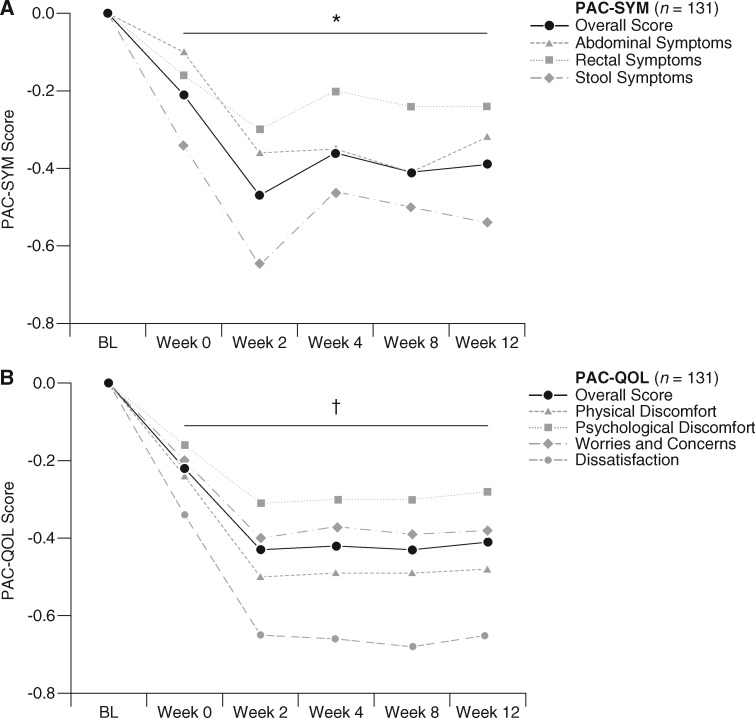
Figure 5.
Change from baseline (predose on day 1 of COMPOSE-4) over time in PAC-SYM (A) and PAC-QOL (B) overall scores and scores for each domain in COMPOSE-5 (mean; FAS). *P ≤ 0.03 versus BL for mean overall scores and scores for each domain of PAC-SYM. †P ≤ 0.0001 versus BL for mean overall scores and scores for each domain of PAC-QOL. BL, baseline; FAS, full analysis set; PAC-QOL, Patient Assessment of Constipation Quality of Life; PAC-SYM, Patient Assessment of Constipation Symptoms.

