
Figure 2. A subset of RSV F-specific infant antibodies binds with high affinity to RSV F and neutralizes RSV.
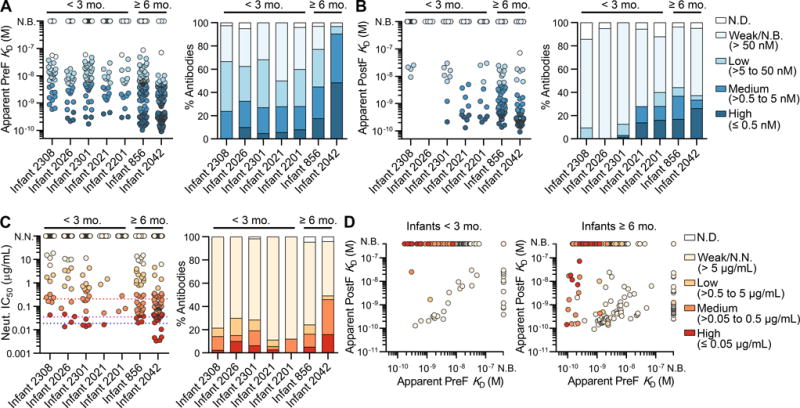
(A) Apparent (IgG) affinity of each antibody for preF (left). Percentage of antibodies with indicated affinities for preF (right). Infants are ordered from youngest to oldest, left to right. Coloring corresponds to the legend shown in (B). N.D., not determined; N.B., non-binding. Results are representative of at least two independent experiments.
(B) Same as (A), except that binding is to postF.
(C) Neutralization potency (IC50) of each antibody (left). Percentage of antibodies with indicated neutralization potencies (right). Red, purple, and blue dotted lines indicate the IC50 values for motavizumab, MPE8 and D25, respectively. N.N., non-neutralizing. Results are derived from a single experiment performed in duplicate.
(D) Affinities for postF plotted against affinities for preF, colored by neutralization potency, for antibodies isolated from infants < 3 mo. (left) and infants ≥ 6 mo. (right).