
Figure 3. Infant responses are focused toward two antigenic sites with different neutralization sensitivities.
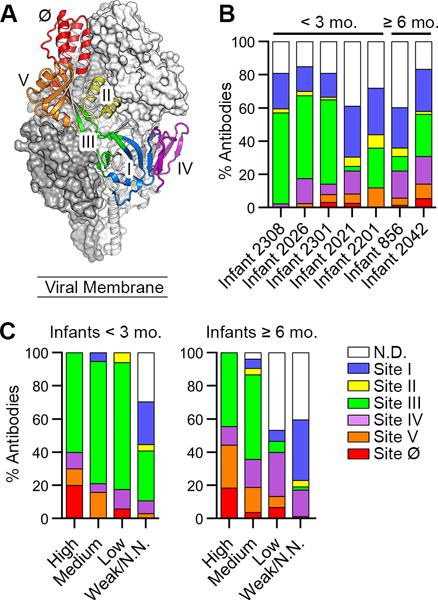
(A) The preF structure with two protomers displayed as gray molecular surfaces and one protomer displayed as ribbons colored according to antigenic site.
(B) Percentage of antibodies directed against each antigenic site, colored as in (A). Infants are ordered from youngest to oldest, left to right.
(C) Percentage of antibodies directed against each antigenic site—grouped according to neutralization potency—isolated from infants < 3 mo. (left) and infants ≥ 6 mo. (right). N.D., not determined; N.N., non-neutralizing.