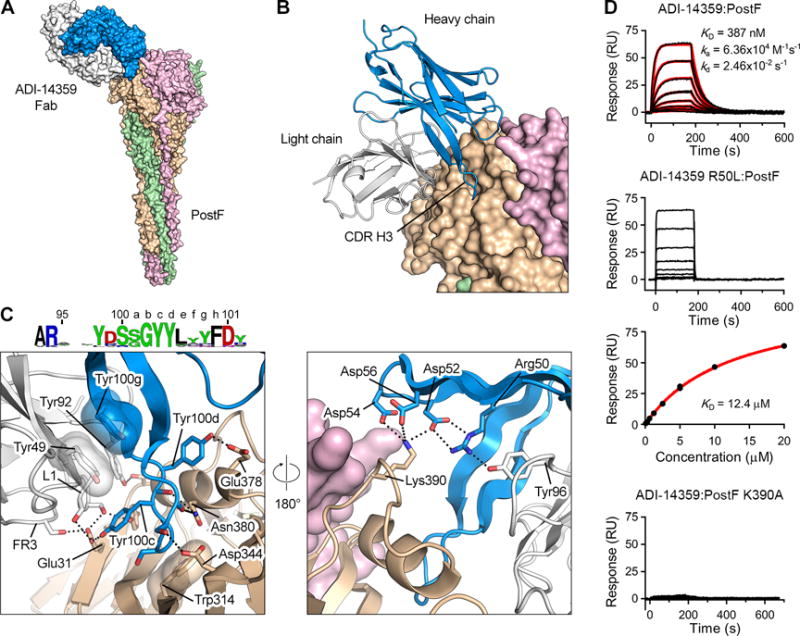
Figure 6. Non-neutralizing antibody ADI-14359 uses a convergent CDR H3 motif and germline features of the VK1-39 light chain for binding to antigenic site I on postF.

(A) Crystal structure of ADI-14359 Fab (VH2-70:VK1-39) in complex with postF shown as molecular surfaces with the three postF protomers colored in tan, pink and green, and the ADI-14359 heavy and light chains colored blue and white, respectively.
(B) The variable domain of ADI-14359 is shown as ribbons and postF is shown as molecular surfaces.
(C) Magnified view of the antibody interface (left) and a 180° rotation about the vertical axis (right), colored as in (A). The variable domain of ADI-14359 and one postF protomer are shown as ribbons. Selected residues are shown as sticks with oxygen atoms colored red and nitrogen atoms colored blue. Hydrogen bonds and salt bridges are depicted as black dotted lines. The residues in the sequence logo of the convergent CDR H3 are colored according to chemical property (Crooks et al., 2004). FR3, framework region 3.
(D) Sensorgram for the binding of ADI-14359 to post F measured using SPR (top). The data were double-reference subtracted (black) and fit to a 1:1 binding model (red). Rate constants for the R50L variant binding to postF were too fast to be accurately determined (second from top) and therefore the equilibrium responses were plotted against the concentration of Fab and fit to a steady-state affinity model (red line) (third from top). Binding of ADI-14359 to the K390A variant of postF was too weak to determine an affinity (bottom). Results are representative of a single experiment.
