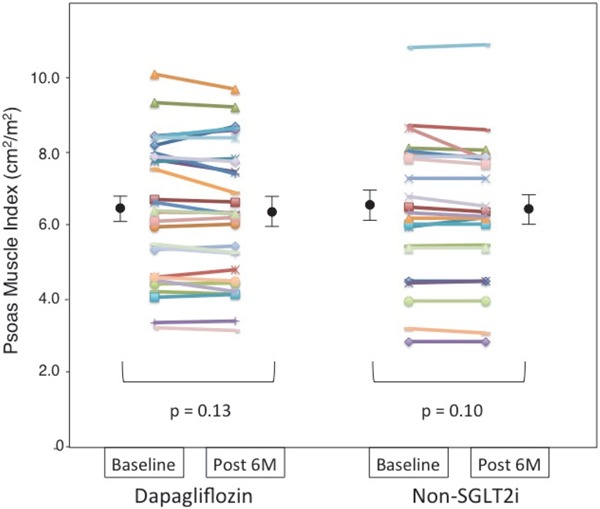
Fig. 3.

Dot plot of the psoas muscle index before and after 6 months of dapagliflozin or non-sodium-glucose co-transporter 2 inhibitor (SGLT2i) therapy as assessed by abdominal computed tomography
Psoas muscle index of each patient before and after each therapy presented as a dot plot, with black circles and bars representing the mean and standard error of the mean, respectively.
