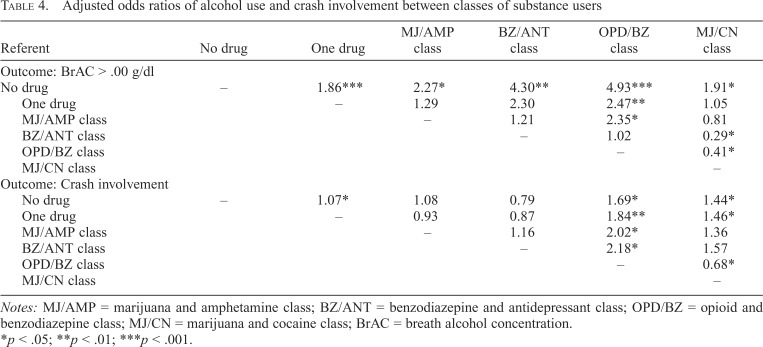
Table 4.
Adjusted odds ratios of alcohol use and crash involvement between classes of substance users
| MJ/AMP | BZ/ANT | OPD/BZ | MJ/CN | |||
| Referent | No drug | One drug | class | class | class | class |
| Outcome: BrAC > .00 g/dl | ||||||
| No drug | – | 1.86*** | 2.27* | 4.30** | 4.93*** | 1.91* |
| One drug | . – | 1.29 | 2.30 | 2.47** | 1.05 | |
| MJ/AMP class | .– | 1.21 | 2.35* | 0.81 | ||
| BZ/ANT class | .– | 1.02 | 0.29* | |||
| OPD/BZ class | .– | 0.41* | ||||
| MJ/CN class | .– | |||||
| Outcome: Crash involvement | ||||||
| No drug | – | 1.07* | 1.08 | 0.79 | 1.69* | 1.44* |
| One drug | . – | 0.93 | 0.87 | 1.84** | 1.46* | |
| MJ/AMP class | .– | 1.16 | 2.02* | 1.36 | ||
| BZ/ANT class | .– | 2.18* | 1.57 | |||
| OPD/BZ class | .– | 0.68* | ||||
| MJ/CN class | .– |
Notes: MJ/AMP = marijuana and amphetamine class; BZ/ANT = benzodiazepine and antidepressant class; OPD/BZ = opioid and benzodiazepine class; MJ/CN = marijuana and cocaine class; BrAC = breath alcohol concentration.
p < .05; **p < .01; ***p < .001.

