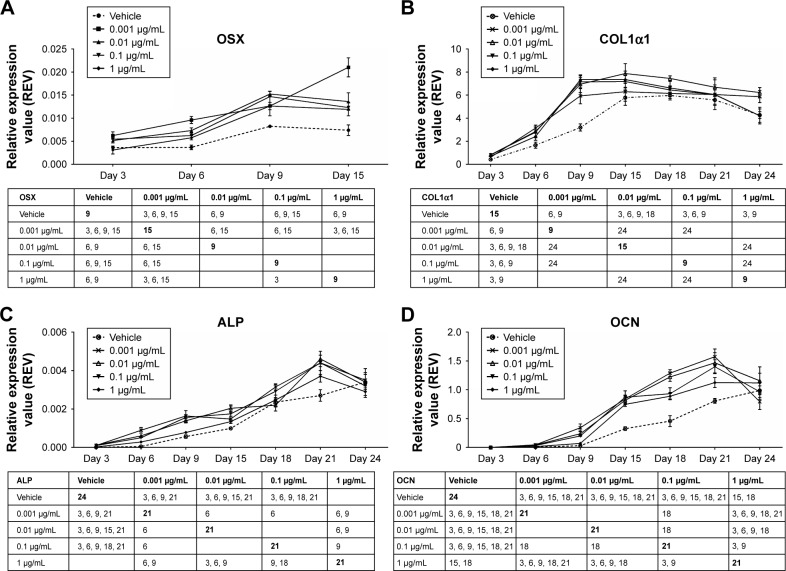
Figure 3.
Gene expression of OSX (A), COL1α1 (B), ALP (C), and OCN (D) in MC3T3-E1 cells after AnTT treatment for day 3, day 6, day 9, day 15, day 18, day 21, and day 24.
Notes: The number in the table shows at which day the two groups are significantly different from each other. The bolded number shows at which day the expression of the studied gene peaks/plateaus. Data are expressed as mean ± SEM.
Abbreviations: ALP, alkaline phosphatase; AnTT, annatto-derived tocotrienol; COL1α1, collagen 1 alpha 1; OCN, osteocalcin; OSX, osterix; REV, relative expression value; SEM, standard error of the mean.

