Figure 6.
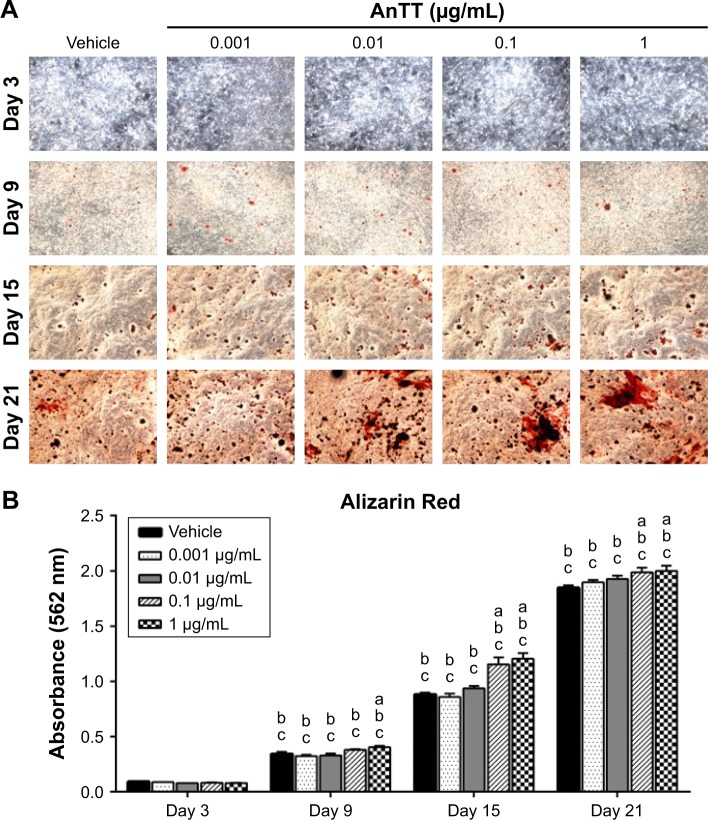
Alizarin Red staining (A) and Alizarin Red quantification (B) on MC3T3-E1 cells after AnTT treatment for day 3, day 9, day 15, and day 21.
Notes: “a” indicates a significant difference between the marked group compared to the vehicle at the same time point; “b” indicates a significant difference between the marked group compared to its previous time point; and “c” indicates a significant difference between the marked group compared to day 3. Data are expressed as mean ± SEM.
Abbreviation: AnTT, annatto-derived tocotrienol.

