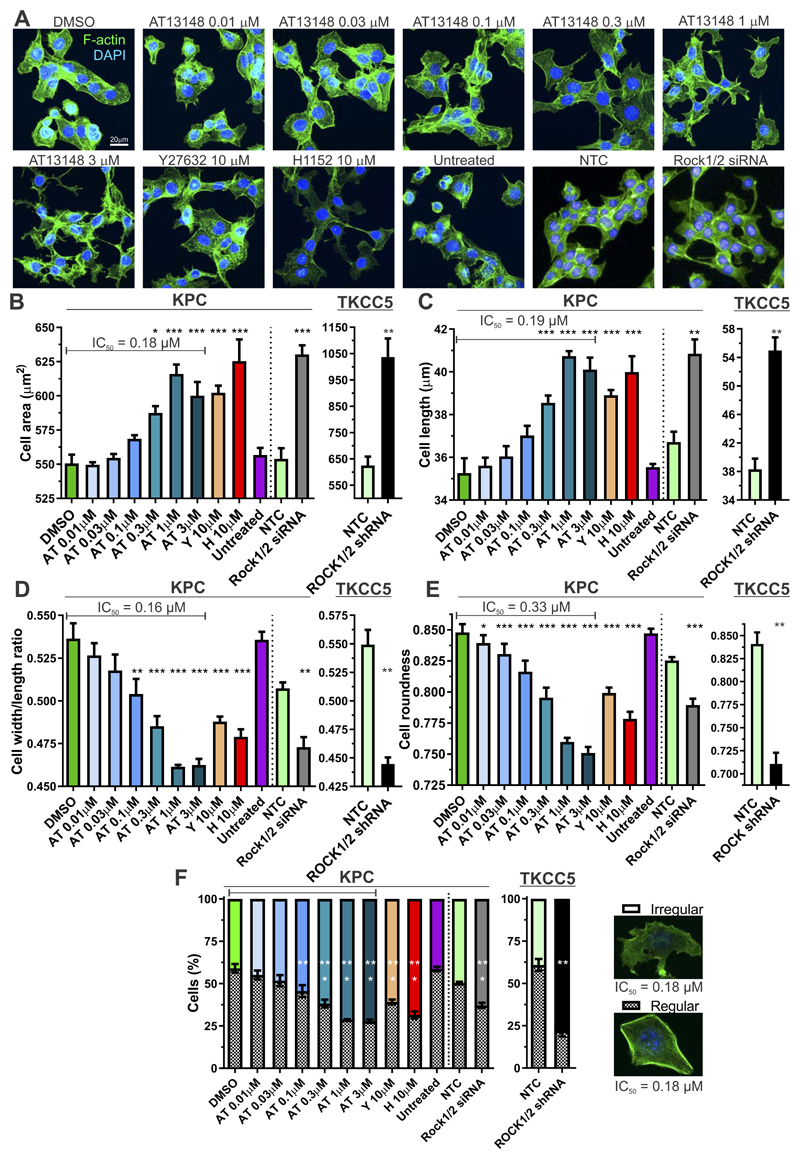
Figure 2. AT13148 affects cell morphology.
A, Representative confocal microscope maximum intensity projection images of F-actin (green) and DAPI (blue) stained KPC cells treated with indicated concentrations of AT13148, Y27632 or H1152 for 1 h. Alternatively, cells were transfected with non-targeting control (NTC) or a mixture of Rock1 + Rock2 (Rock1/2) siRNAs and imaged on an Operetta High Content Imaging System. High content imaging of KPC cells after 1 h of AT13148, Y27632 or H1152 drug treatment, or 24 h post siRNA transfection (left graphs), or >7 days post lentiviral transduction of TKCC5 cells with NTC or ROCK1 and ROCK2 targeted shRNAs (right graphs), was used to determine B, cell area; C, cell length; D, cell width/length ratios; E, cell roundness. Means ± SEM are shown from n = 3 independent experiments for drug treatments, n = 4 independent experiments for siRNA transfections, or n = 3 independent experiments with shRNA knockdown cells. Statistical significance was determined using one-way ANOVA and post-hoc Dunnett’s multiple comparison test for AT13148, Y276732 or H1152 treatments. Statistical significance was determined for the comparisons of corresponding NTC with Rock1/2 or ROCK1/2 knockdown by unpaired Student’s t-test. *, p<0.05; **, p<0.01; ***, p<0.001. F, Multiparametric analysis was used to classify cells as irregular (white bar) or regular (hatched bar), as typified by the indicated cells. Means ± SEM are shown from n = 3 independent experiments, n = 4 independent experiments for siRNA transfections, or n = 3 independent experiments with shRNA knockdown cells. Statistical significance was determined using one-way ANOVA and post-hoc Dunnett’s multiple comparison test for AT13148, Y276732 or H1152 treatments. Statistical significance was determined for the comparisons of corresponding NTC with Rock1/2 or ROCK1/2 knockdown by unpaired Student’s t-test. **, p<0.01; ***, p<0.001.

