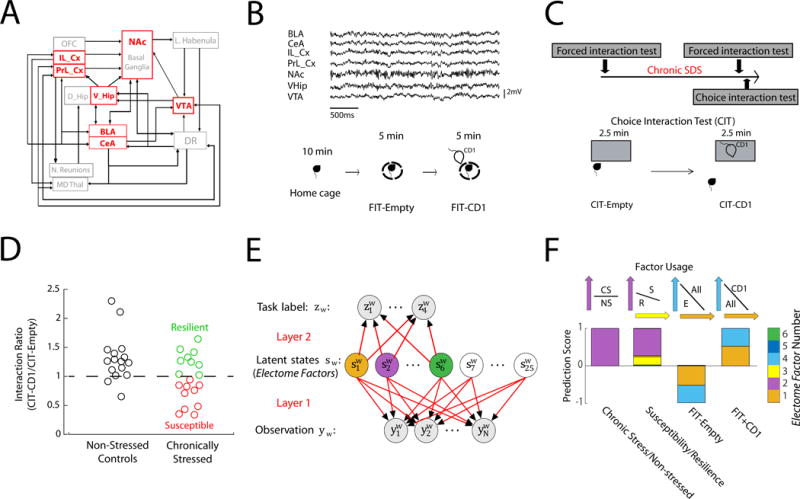
Figure 1. Identification of stress-related networks using machine learning.

A) Partial structural wiring diagram across MDD related brain regions in mice. We recorded from areas shown in red. B) Sample LFP traces recorded concurrently from seven implanted brain areas (top). Homecage—Forced interaction test (FIT) used to probe brain activity during: homecage, placed inside a small sub-chamber in an empty cage, or inside small sub-chamber in a cage with a CD1 mouse (bottom). C) Experimental timeline (top), and schematic of choice interaction test (CIT) to identify susceptible vs. resilient mice after cSDS (bottom). D) Choice interaction ratios after 10 days of cSDS compared to non-stress controls. E) Cross-spectral factor analysis model where observations are brain features (LFP power, cross-area synchrony, and cross-area phase offsets) that are shared by latent states (networks). These networks coordinate distinct ‘emotional brain states’ represented by a given task label (i.e. susceptibility vs. resilience). We trained 25 descriptive latent networks. Six of these networks were also trained to be predictive F) Four networks/Electome Factors identified using a support vector machine jointly discriminated the stress states (Networks 1, 2, 3, and 4). Example support vectors are shown above.
