Figure 2.
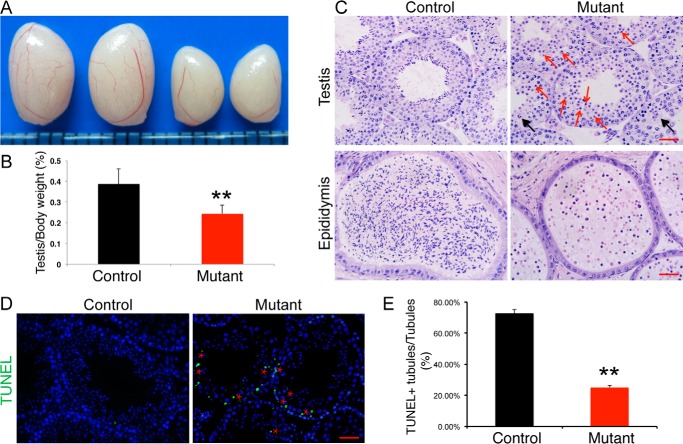
Impaired spermiogenesis in Setd2 cKO mice. A, gross morphology of representative testes from an 8-week-old control and age-matched Setd2 cKO mice. B, comparison of testis weight from 8-week-old controls and Setd2 cKO mice. Data are presented as mean ± S.D. (n = 8 for each genotype). C, H&E staining of testis and epididymis from control and Setd2 cKO adult mice. Red arrows indicate apoptotic spermatocytes and spermatids; black arrows represent multinucleated giant cells (formed by arrested spermatids). D, TUNEL staining of representative testes from adult control and age-matched Setd2 cKO mice. Apoptotic cells were labeled by TUNEL staining (green). The red stars indicate the spermatocyte and spermatid layer. E, comparison of TUNEL-positive seminiferous tubules from adult controls and Setd2 cKO mice. Data are presented as mean ± S.D. (n = 3 for each genotype). Error bars represent S.D. **, p < 0.01, t test (scale bars, 40 μm).

