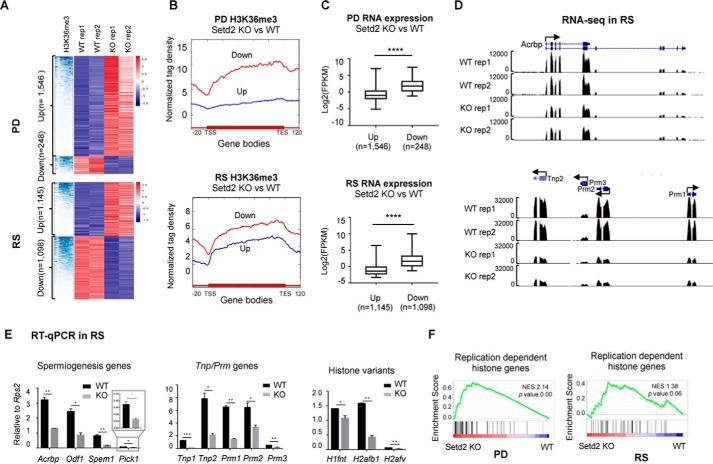
Figure 6.
Compromised expression of key spermiogenesis regulators and genes involved in histone-to-protamine replacement in PD and RS upon Setd2 loss. A, hierarchical clustering analyses of H3K36me3 ChIP-seq and RNA-seq of the differentially expressed genes in PD and RS cells from control and Setd2 cKO. B, signal plot showing the H3K36me3 distribution over the up- and down-regulated genes in PD (p = 1.54e−92, analysis of variance test) and RS (p = 1.23e−34, analysis of variance test) cells upon Setd2 loss. C, box plot analyses of the expression levels of the up- and down-regulated genes in PD and RS cells upon Setd2 loss. ****, p < 0.0001 by unpaired t test. D and E, expression analyses of the indicate genes in PD and RS cells upon Setd2 loss. D, snapshots showing RNA-seq results. E, RT-qPCR confirmation. Data are represented as mean ± S.D. from two biological replicates. *, p < 0.05; **, p < 0.01, ***, p < 0.001 by t test. Error bars represent S.D. F, gene set enrichment analyses of histone gene expression in PD and RS cells from Setd2 cKO versus control. Normalized enrichment score (NES) and nominal p value are provided according to gene set enrichment analyses. TSS, transcription start site; TES, transcription end site.

