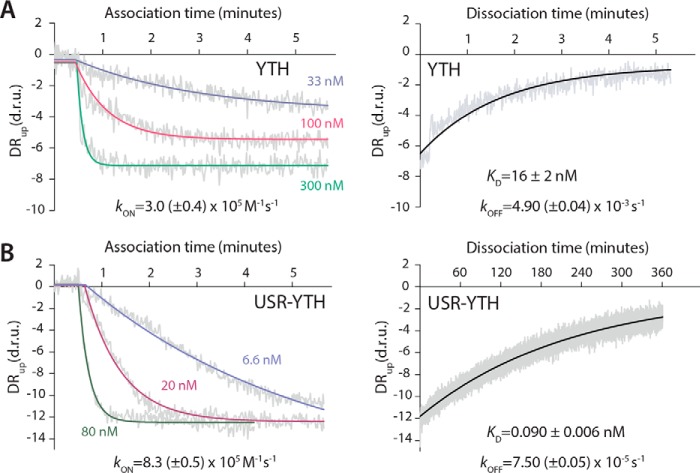
Figure 2.
The USR slows the off-rate of the YTH domain for RNA. Association and dissociation kinetics were calculated for the YTH (A) and USR–YTH (B) constructs. SwitchSENSE association binding curves at the indicated protein concentrations, plotted as dynamic response (DRup) in dynamic response units (d.r.u.) versus time are shown on the left. Dissociation curves, generated by flowing buffer across the chip surface saturated with YTH or USR–YTH protein, are shown on the right. Dynamic response (gray) is the integrated fluorescence intensity between 2 and 6 μs. Fitted exponential decay curves are shown with calculated rate constants and standard errors.

