Figure 3.
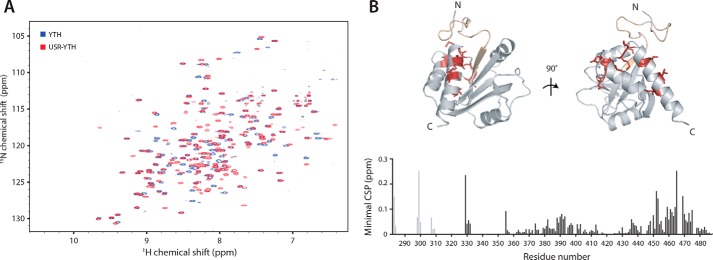
The USR alters the chemical environment of the C terminus of Mmi1. 2D NMR spectral analysis of YTH and USR–YTH constructs was performed. A, overlay of 1H-15N BEST-TROSY spectra of YTH and USR–YTH constructs. B, nearest neighbor chemical shift perturbation (CSP) maps of the assigned USR–YTH construct versus the unassigned YTH construct (bottom). Lighter gray peaks denote residues present in the USR–YTH construct but not the YTH construct. Regions that have large chemical shift differences (above 0.1 ppm; red) or are line broadened (yellow) are mapped onto the crystal structure of the Mmi1 YTH domain (top).

