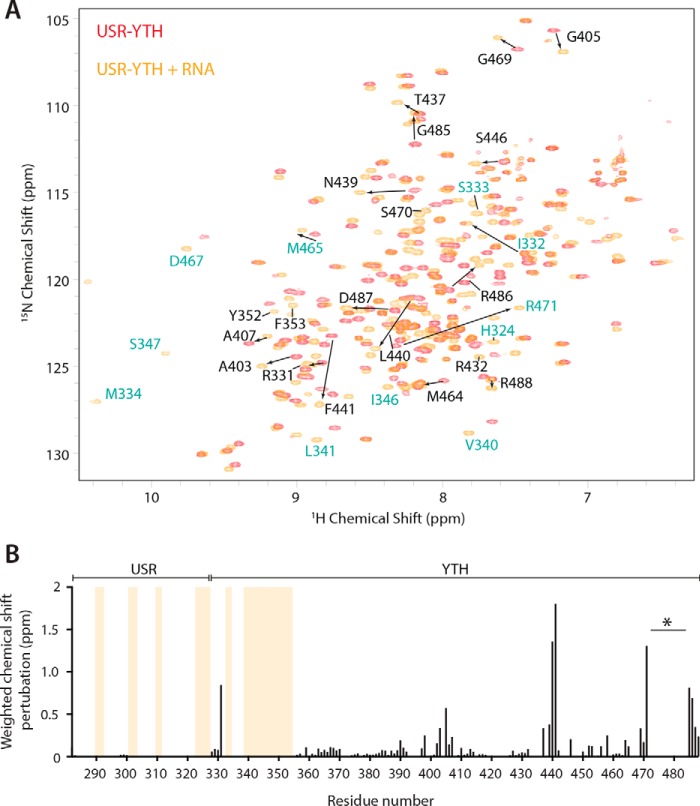
Figure 5.
The USR becomes more ordered on RNA binding. A, overlay of the 1H-15N BEST-TROSY spectra of USR–YTH Mmi1 in the absence (red) and presence (orange) of RNA. Selected assigned peaks that show large chemical shift perturbations (denoted with arrows) or appear on RNA binding are labeled. Residues labeled in turquoise are shown in Fig. 4B. B, plot showing the chemical shift perturbations per residue. Yellow bars indicate peaks that are only present in the RNA-bound form. The gap in the C-terminal region (asterisk) is due to line broadening in the presence of RNA. Other missing signals in the core YTH domain fold are due to incomplete back-exchange of the deuterated protein.

