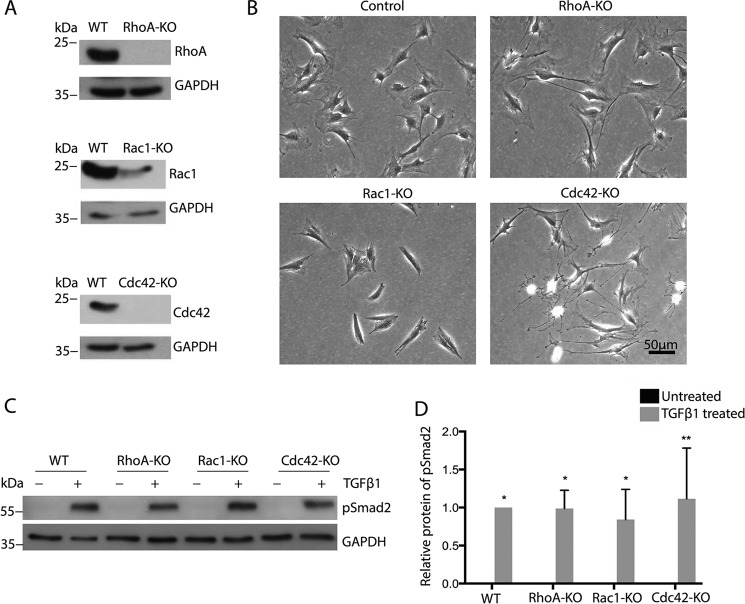
Figure 3.
Rho GTPase-deficient MSC show clear morphological changes but normal Smad2 phosphorylation in response to TGFβ. A, representative Western blotting for the indicated proteins of MSC with knockout of RhoA, Rac1, and Cdc42. B, bright field microscopy of MSC with indicated gene deletions. C and D, representative Western blotting and quantification of lysates of indicated cells for pSmad2 (black bars, 24-h TGFβ; gray bars, untreated; n = 3/3).

