Figure 7.
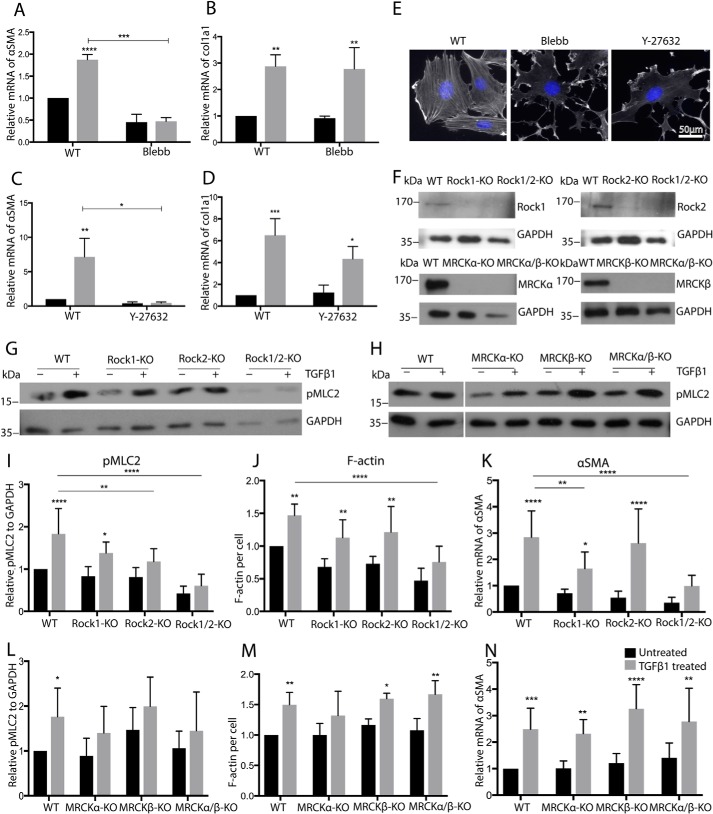
TGFβ-induced αSMA induction of MSC correlates with changes in contraction and F-actin. A–D, qRT-PCR analysis for the indicated genes of WT cells treated with blebbistatin (Blebb (A and B)) or Y-27632 (C and D) (n = 3/3). E, F-actin of MSC treated with blebbistatin or Y-27632, detected by fluorescently labeled phalloidin. F, representative Western blotting for the indicated proteins of MSC with knockout of Rock1, Rock2, MRCKα, and MRCKβ. G–I and L, representative Western blotting and quantification of lysates of indicated cells for pMLC2 (n = 6/6). J and M, quantification of phalloidin staining of indicated MSC (n = 5/5). K and N, qRT-PCR analysis for αSMA of MSC with indicated KO (n = 5/5). A–D, J, K, M, and N, black bars, 24-h TGFβ; I and L, black bars, 2-h TGFβ; gray bars, untreated. ****, p < 0.0001.

