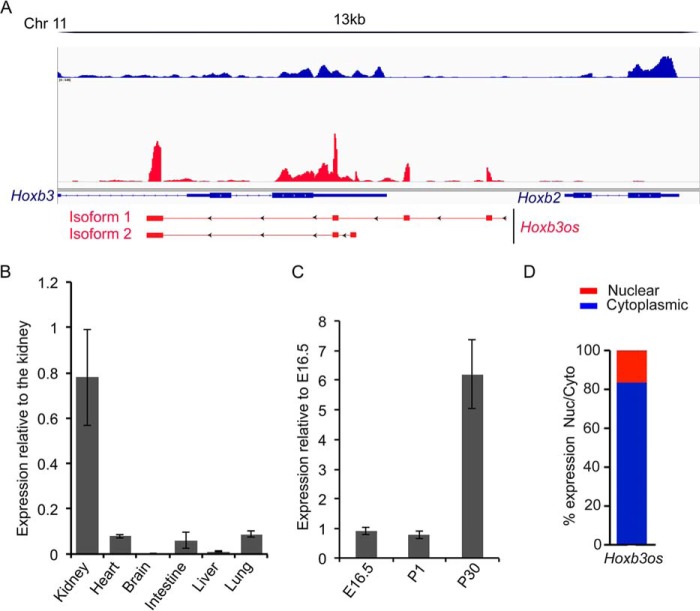
Figure 2.
Expression of Hoxb3os in the mouse kidney. A, RACE identifies two major Hoxb3os isoforms in the mouse kidney. Upper panel shows RNA-Seq reads from a WT kidney visualized with Integrative Genomics Viewer software (blue bars indicate reads from positive strand and red bars indicate negative strand). The two Hoxb3os isoforms (lower panel) are located 5′ to Hoxb2 and partially overlap with Hoxb3 (arrowheads indicate direction of transcription and solid rectangles indicate exons). B, quantitative RT-PCR showing expression of Hoxb3os in different mouse organs relative to the kidney. C, developmental expression of Hoxb3os in the embryonic (E16.5), newborn (P1), and adult (P30) mouse kidney measured by qRT-PCR. D, percentage of Hoxb3os expression in cytoplasmic and nuclear fractions from an adult mouse kidney measured by qRT-PCR. Error bars indicate S.E.

