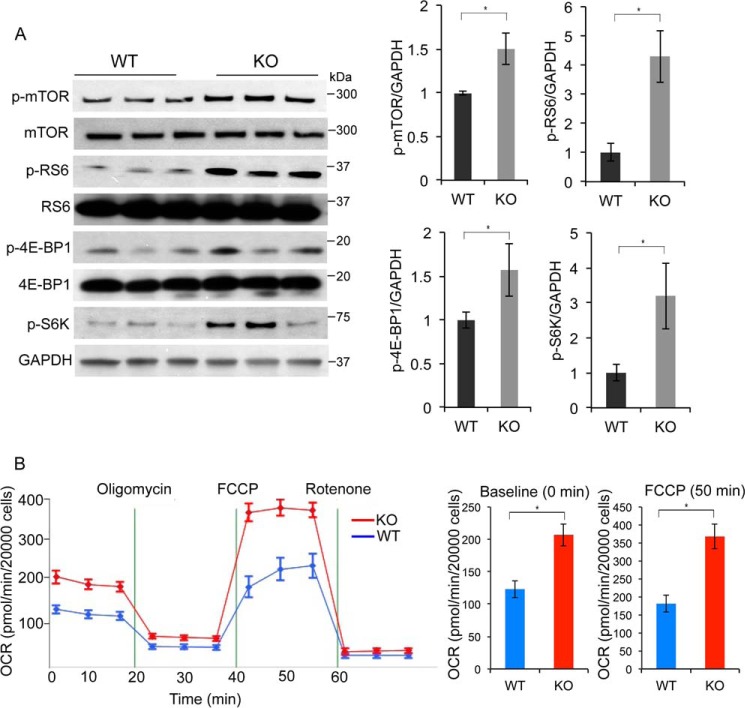
Figure 5.
Ablation of Hoxb3os in kidney cells results in up-regulation of mTOR signaling and enhanced mitochondrial respiration. A, Western blot analysis showing the levels of mTOR and p-mTOR, RS6, and p-RS6, eukaryotic translation initiation factor 4E-BP1 and p-4E-BP1, p-S6K, and GAPDH in WT and Hoxb3os knockout (KO) cells. Right panel shows densitometric analysis of the Western blots. B, measurement of OCR in WT (blue) and Hoxb3os KO (red) cells under basal conditions and in response to the indicated mitochondrial inhibitors. Addition of the protonophore FCCP reveals the maximal respiratory capacity of the cells. The rate of respiration at baseline and in response to FCCP is quantified in the right panel. Error bars indicate S.E. *, p < 0.05.

