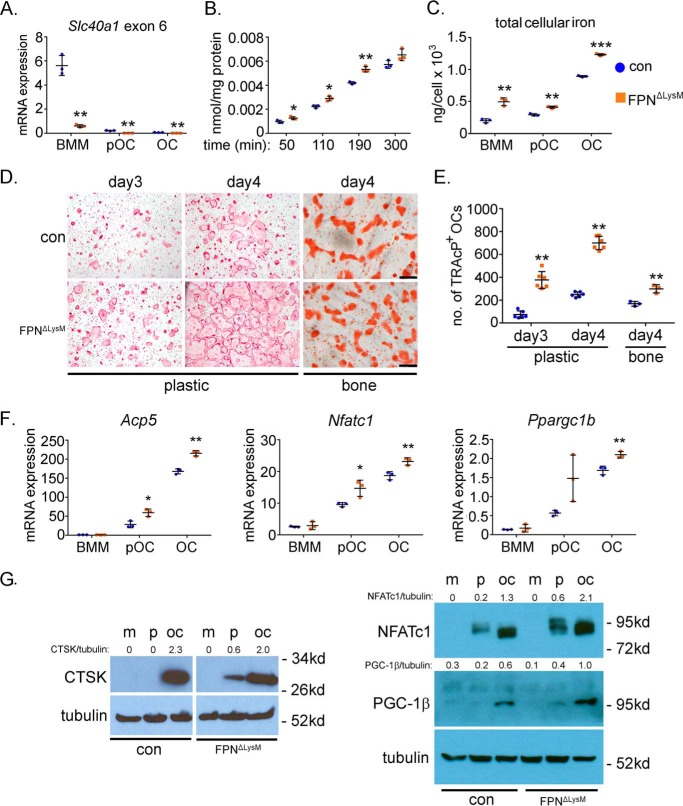
Figure 3.
Loss of Fpn in BMMs enhances cellular iron accumulation and accelerates osteoclast formation in vitro. Bone marrow monocytes were cultured with M-CSF (BMM) or M-CSF + RANKL for 2 and 4 days to generate mononuclear pre-osteoclasts (pOC) and mature multinucleated osteoclasts (OC), respectively. A, mRNA expression of Fpn, encoded by Slc40a1, was detected by qPCR using a primer specific to the exon 6 of murine Slc40a1. n = 3. B, intracellular levels of uptaken Tf-Fe59 in control (con) and Fpn-deleted (FpnΔLysM) BMMs were measured by a gamma counter. The data were normalized by protein concentrations. n = 3. C, amount of cellular total iron was measured using a colorimetric iron assay kit. The data were normalized by cell number in each well of a 6-well plate. n = 3. D, TRAcP staining of control and Fpn-deleted osteoclastogenic cultures on plastic and bone slices. E, quantification of the number of TRAcP+ osteoclasts with more than three nuclei per well of a 48-well plate, n = 6, and per slice of bovine cortical bone, n = 3. F, mRNA expression of osteoclast marker genes in osteoclast lineage cells detected by quantitative real-time PCR. Acp5, encoding TRAcP; Nfatc1, encoding NFATc1; Ppargc1b, encoding PGC-1β. n = 3. G, protein expression of cathepsin K (CTSK), NFATc1, and PGC-1β during osteoclast differentiation was detected by Western blottings. Tubulin served as loading controls. The densitometry quantification of each band was done by ImageJ (National Institutes of Health). The ratios of band density of CTSK, NFATc1, and PGC-1β to that of corresponding tubulin are presented. m, BMMs; p, pre-osteoclasts; oc, mature osteoclasts. The representative data from three independent experiments are shown. *, p < 0.05; **, p < 0.01 versus control (con) by one-way ANOVA.

