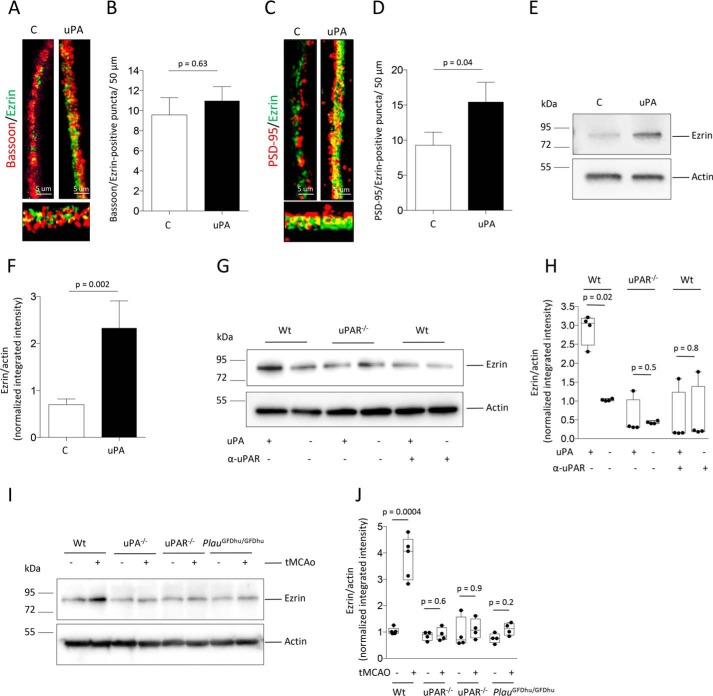
Figure 2.
uPA induces the recruitment of ezrin to the postsynaptic density. A–D, representative confocal microscopy micrographs (A and C) and mean number of bassoon/ezrin–positive (B) and PSD-95/ezrin–positive (D) puncta/50 μm in WT cerebral cortical neurons treated 60 min with 5 nm of uPA or a comparable volume of vehicle (control: C). n = 450 neurons examined from three different cultures. The lines denote S.E. Magnification, 40×. E and F, representative immunoblot (E) and mean intensity of the band (F) of ezrin expression in PSD extracts prepared from WT cerebral cortical neurons treated 60 min with 5 nm of uPA or a comparable volume of vehicle (control: C). The data are expressed as means ± S.E. for n = 6 observations. G and H, representative Western blotting analysis (G) and mean intensity of the band (H) of ezrin expression in PSD extracts from WT and uPAR−/− cerebral cortical neurons treated 60 min with 5 nm of uPA or vehicle (control). A subgroup of WT neurons was treated with uPA in the presence of 4 μg/ml of anti-uPAR blocking antibodies. The data are expressed as means ± S.E. for n = 4 observations. I and J, representative immunoblot (I) and quantification of the mean intensity of the band (J) of ezrin expression in PSD extracts prepared from the left frontoparietal cortex of WT, uPA−/−, uPAR−/−, and PlauGFDU/GFDhu mice after 30 min of either tMCAo or sham operation. The data are expressed as means ± S.E. for n = 4 observations per experimental group.

