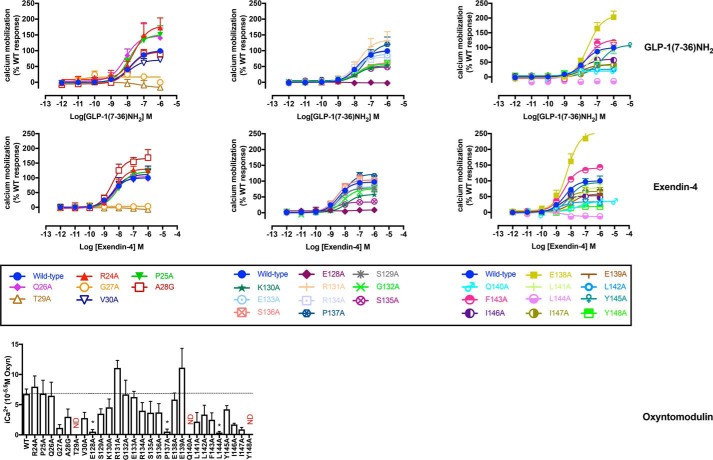
Figure 5.
[Ca2+]i mobilization concentration-response curves for Ala mutants of the hGLP-1R N-terminal ECD and TM1 and linker region. Concentration-response curves of [Ca2+]i mobilization of WT and mutant receptors were stimulated by GLP-1(7–36)NH2 (upper panels), exendin-4 (middle panels), or oxyntomodulin (lower panels) in CHO–Flp-In cells stably expressing WT or mutant receptors. Data were normalized to the response elicited by the WT and analyzed with an operational model of agonism. All values are means ± S.E. of four to six independent experiments, conducted in duplicate.

