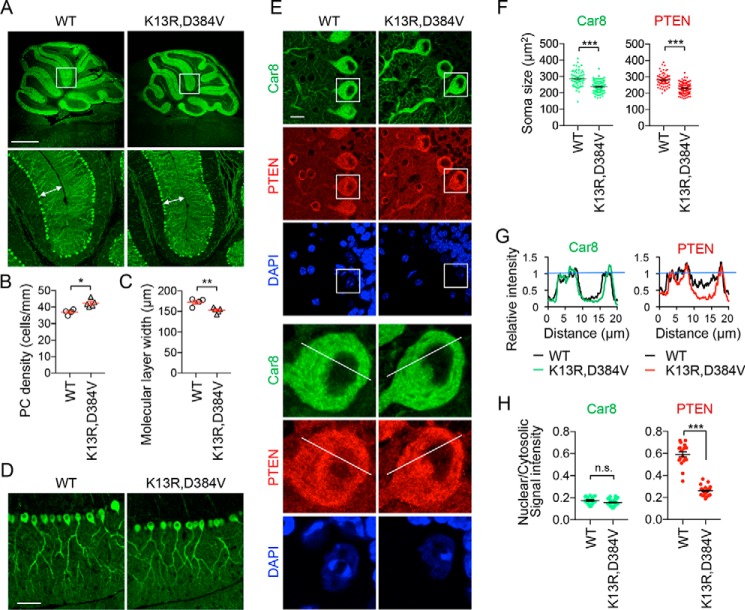
Figure 3.
Decreased neuron size and nuclear PTEN levels in the cerebellum of PTENK13R, D384V mice. A–D, sagittal sections of the cerebellum cut in the midline were immunostained with anti-Car8 antibodies. Boxed regions are enlarged in A. The density of the soma of PCs and the width of the molecular layer (arrows in A) are quantified in B and C, respectively. Bars are the mean ± S.E. (n = 4 control and 5 PTENK13R, D384V mice). D, higher magnification images of the molecular layer. E, sagittal sections of the cerebellum in the midline were immunostained with antibodies to Car8 and PTEN along with DAPI. Boxed regions are enlarged. F, the area of the soma of PCs is quantified using Car8 and PTEN staining. Bars are the mean ± S.E. (n = 80 control and 111 PTENK13R, D384V cells). G, the fluorescent intensity of Car8 (green) and PTEN (red) was quantified along lines in E. H, the mean intensity of Car8 and PTEN in the nucleus relative to the cytosol was determined. Bars are the mean ± S.E. (n = 73 control and 93 PTENK13R, D384V cells). Statistical analysis was performed using the Student's t test: *, p < 0.05; **, p < 0.01; ***, p < 0.001. Scale bars, 0.1 cm in A, 50 μm in D, and 10 μm in E.

